Spiral Layout: Creating Elegant Circular Graph Visualizations
Spiral Layout is a unique graph visualization solution that arranges nodes in elegant spiral patterns, creating visually striking and intuitive diagrams. Built with ReactFlow, this tool transforms traditional hierarchical and circular data into beautiful spiral arrangements that reveal relationships and patterns in new ways.
Understanding Spiral Layouts
Traditional graph layouts often struggle with displaying circular or hierarchical data in an engaging manner. Spiral Layout solves this by implementing sophisticated algorithms that position nodes along spiral paths, creating natural flow patterns that guide the eye and make complex relationships easier to understand. The result is both functional and aesthetically pleasing.
Spiral layouts offer several unique advantages:
- Visual Appeal: Creates eye-catching, artistic visualizations that stand out
- Natural Flow: Spiral patterns guide the eye naturally through the data
- Space Efficiency: Maximizes use of available space with circular arrangement
- Hierarchical Clarity: Maintains hierarchical relationships while adding visual interest
- Pattern Revelation: Reveals circular and cyclical relationships in data
Key Features
Spiral Layout Algorithm
The core of this solution is an advanced algorithm that calculates optimal node positions along spiral paths. The algorithm considers multiple factors including node relationships, hierarchy levels, and visual balance to create the most effective spiral arrangement.
// Example: Spiral layout configuration
const spiralConfig = {
  centerX: 400, // Center X coordinate
  centerY: 400, // Center Y coordinate
  startRadius: 50, // Starting radius for first node
  radiusIncrement: 30, // Radius increase per level
  angleIncrement: 0.5, // Angle increment in radians
  rotation: 0, // Initial rotation angle
  clockwise: true, // Spiral direction
};
Customizable Radius and Spacing
Fine-tune the appearance of your spiral layout with adjustable parameters. Control the starting radius, spacing between nodes, and how tightly the spiral winds to match your visualization needs.
// Example: Calculating spiral positions
function calculateSpiralPosition(index, config) {
  const angle = config.rotation + index * config.angleIncrement;
  const radius = config.startRadius + index * config.radiusIncrement;

  return {
    x: config.centerX + radius * Math.cos(angle),
    y: config.centerY + radius * Math.sin(angle),
  };
}
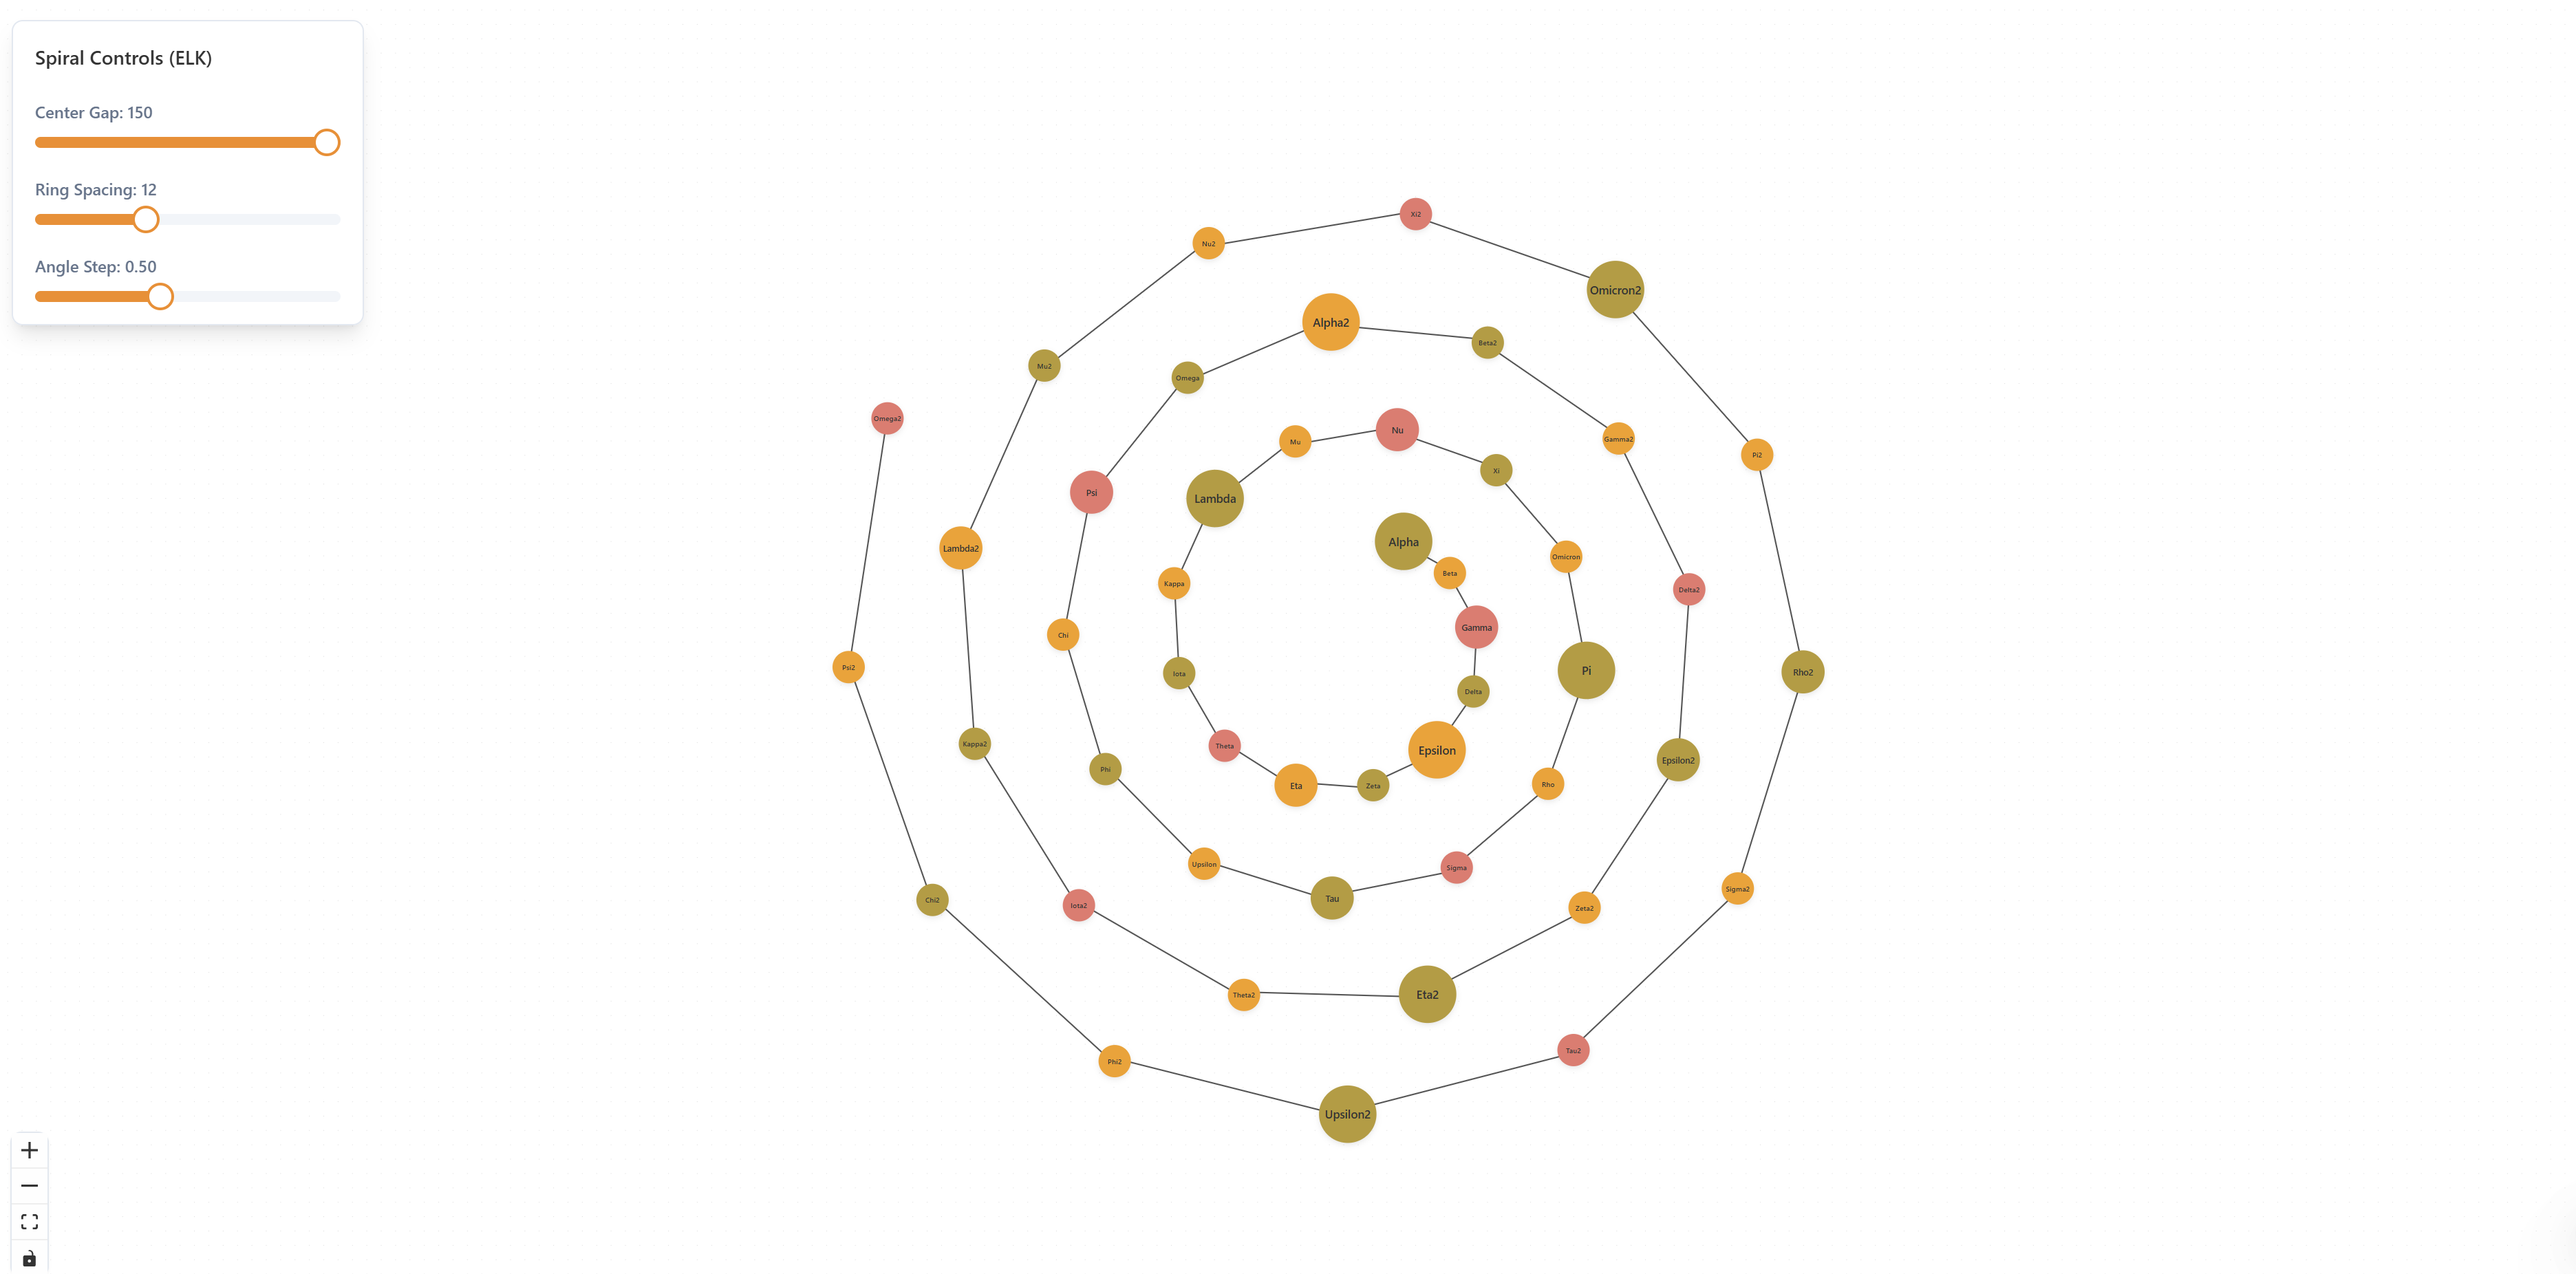
Interactive Controls
Real-time adjustment of spiral parameters with interactive sliders and controls provides immediate visual feedback. Users can experiment with different configurations to find the perfect layout for their data.
Smooth Animations
Beautiful transition animations when nodes are added, removed, or repositioned create a polished user experience. The spiral smoothly expands or contracts as the data changes, maintaining visual continuity.
Export Capabilities
Export spiral layouts to PNG, SVG, PDF, or JSON formats for sharing, documentation, or further processing. High-resolution exports ensure professional-quality visualizations for presentations and reports.
Implementation Details
Spiral Types
The solution supports various spiral patterns:
- Archimedean Spiral: Constant spacing between turns
- Logarithmic Spiral: Exponential growth for hierarchical data
- Fibonacci Spiral: Golden ratio-based arrangement
- Custom Spirals: User-defined spiral functions
Node Positioning
Nodes are positioned along the spiral path based on:
- Hierarchical Level: Different radius levels for different hierarchy depths
- Node Relationships: Related nodes positioned closer together
- Data Attributes: Custom attributes can influence positioning
- Visual Balance: Algorithm ensures even distribution
Layout Optimization
The algorithm optimizes for:
- Readability: Ensures nodes are clearly visible and not overlapping
- Aesthetics: Creates visually pleasing arrangements
- Relationship Clarity: Maintains visual connections between related nodes
- Space Utilization: Maximizes use of available canvas space
Use Cases
Organizational Chart Visualization
Create stunning organizational charts with spiral arrangements. The spiral pattern naturally shows hierarchy while adding visual interest that makes the chart more engaging than traditional top-down layouts.
Family Tree and Genealogy Mapping
Visualize family trees with spiral layouts that show generations radiating outward. The circular arrangement makes it easy to see family relationships and trace lineages through the spiral pattern.
Circular Workflow Diagrams
Design circular workflows and process diagrams where the spiral pattern represents the cyclical nature of processes. Perfect for showing iterative processes, feedback loops, and continuous improvement cycles.
Process Flow Visualization
Visualize process flows with spiral arrangements that guide viewers through sequential steps. The natural flow of the spiral makes it easy to follow the process from start to finish.
Artistic Data Visualization
Create artistic and creative data visualizations that combine functionality with aesthetic appeal. Spiral layouts are perfect for presentations, infographics, and creative projects where visual impact matters.
Hierarchical Data Representation
Represent hierarchical data structures in a visually engaging way. The spiral pattern maintains hierarchical relationships while creating a more interesting visualization than traditional tree structures.
Benefits
Visually Striking Layouts
Spiral layouts create unique, eye-catching visualizations that stand out from traditional graph layouts. The artistic quality makes them perfect for presentations and public-facing visualizations.
Pattern Revelation
The spiral arrangement reveals patterns in circular and hierarchical data that might not be obvious in other layouts. Cyclical relationships and circular dependencies become more apparent.
Improved Data Comprehension
The natural flow of spiral patterns guides the eye through data in a logical sequence, improving comprehension and making complex relationships easier to understand.
Professional Design Quality
Spiral layouts add a professional, polished look to visualizations. The aesthetic appeal makes them suitable for client presentations, reports, and documentation.
Flexible Customization
Extensive customization options allow users to adapt spiral layouts to their specific needs. Adjust parameters to create the perfect visualization for any data structure.
Space Efficiency
Spiral arrangements efficiently use available space, allowing more nodes to be displayed clearly in a given area compared to some traditional layouts.
Technical Implementation
The solution is built with:
- React: Modern UI framework for interactive components
- TypeScript: Type-safe development for reliability
- ReactFlow: Powerful graph visualization library
- Mathematical Algorithms: Advanced spiral calculation algorithms
- Canvas API: High-performance rendering
- SVG: Scalable vector graphics for crisp rendering
Integration
The Spiral Layout solution can be integrated into:
- React and Next.js applications
- Vue and Angular projects
- Data visualization dashboards
- Presentation tools
- Custom visualization platforms
Export spiral layouts to PNG, SVG, PDF, or JSON formats. Import node data from various sources including CSV, JSON, or API endpoints. Compatible with React, Next.js, Vue, or any modern JavaScript framework. API available for programmatic layout generation and integration with data visualization platforms.
Best Practices
Choose Appropriate Spiral Type
Select the spiral type that best matches your data structure. Archimedean spirals work well for uniform data, while logarithmic spirals are better for hierarchical structures.
Optimize Spacing
Adjust radius and angle increments to ensure nodes are clearly visible and not overlapping. Balance between compactness and readability.
Consider Data Size
Spiral layouts work best with moderate-sized datasets. For very large graphs, consider using clustering or grouping techniques.
Use Color Coding
Enhance spiral layouts with color coding to distinguish different node types, categories, or hierarchy levels.
Test Different Configurations
Experiment with different spiral parameters to find the configuration that best represents your data. The interactive controls make it easy to test variations.
Conclusion
Spiral Layout provides a unique and powerful approach to graph visualization that combines functionality with aesthetic appeal. Whether you're creating organizational charts, family trees, workflow diagrams, or artistic visualizations, spiral layouts offer a fresh perspective that makes data more engaging and easier to understand.
The combination of sophisticated algorithms, extensive customization options, and smooth animations creates a professional tool that transforms how you visualize circular and hierarchical data. Start creating stunning spiral visualizations today and discover how this elegant layout can enhance your data presentations.