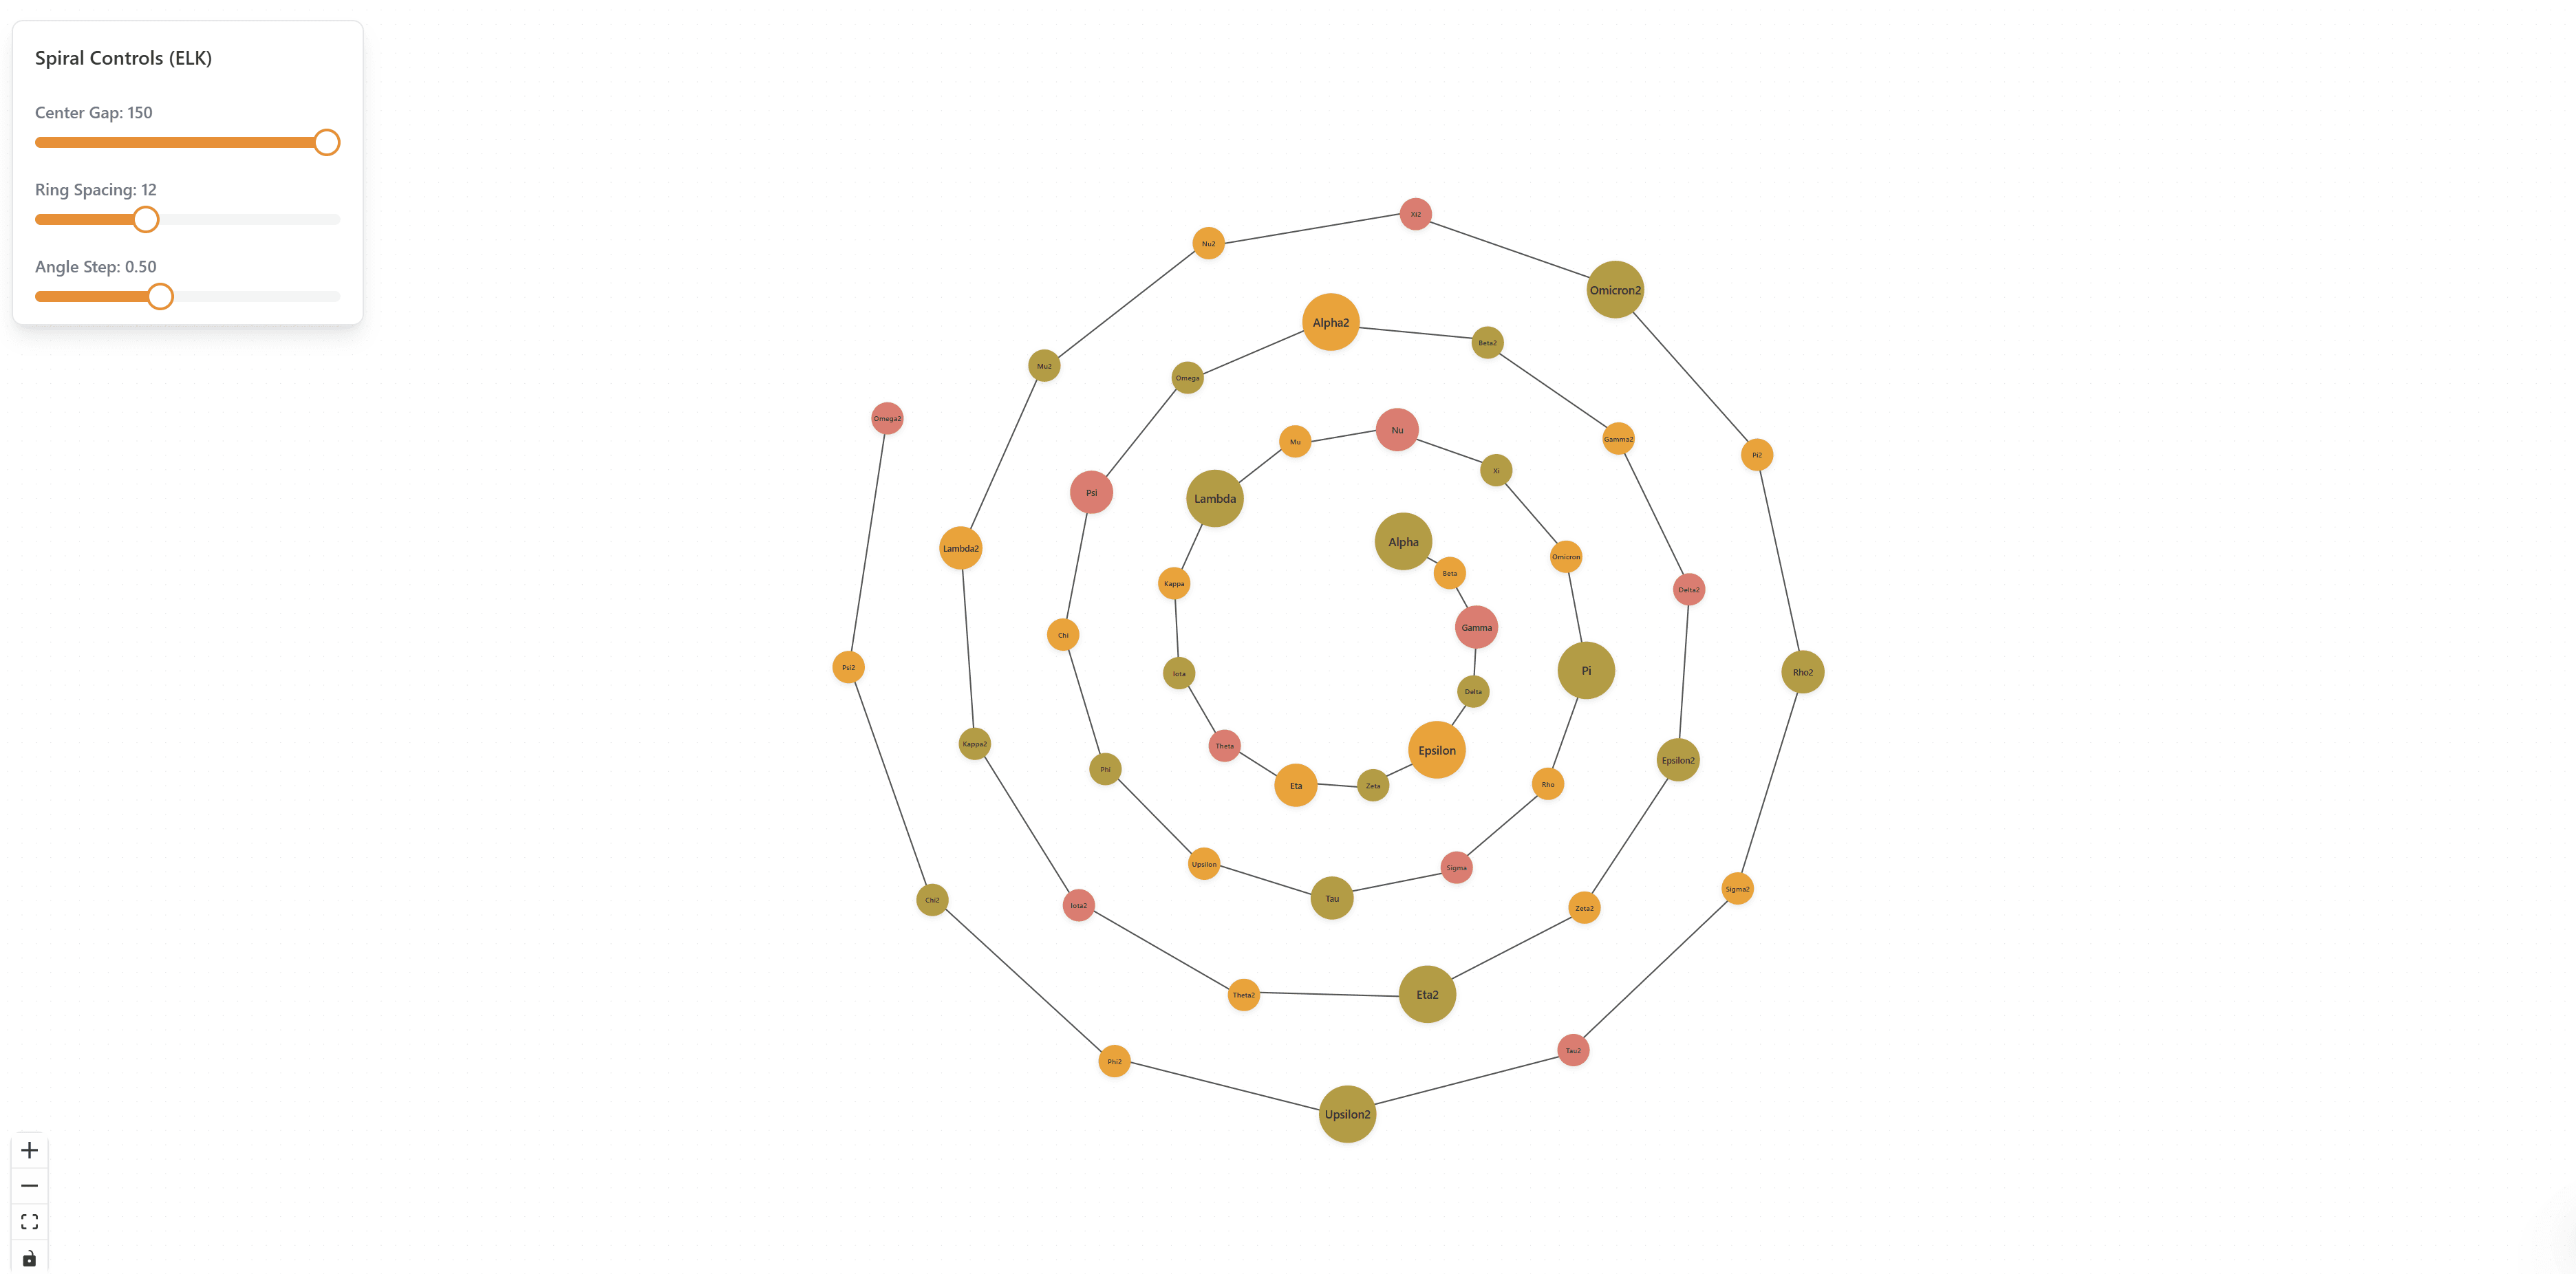
Force-Directed Layout: Advanced Graph Visualization with ReactFlow
Force-Directed Layout is an advanced graph visualization solution that leverages physics-based algorithms to automatically arrange nodes in an optimal layout. Built with ReactFlow and modern web technologies, this powerful tool uses force-directed graph drawing techniques to create beautiful, readable network diagrams without manual positioning.
Understanding Force-Directed Layouts
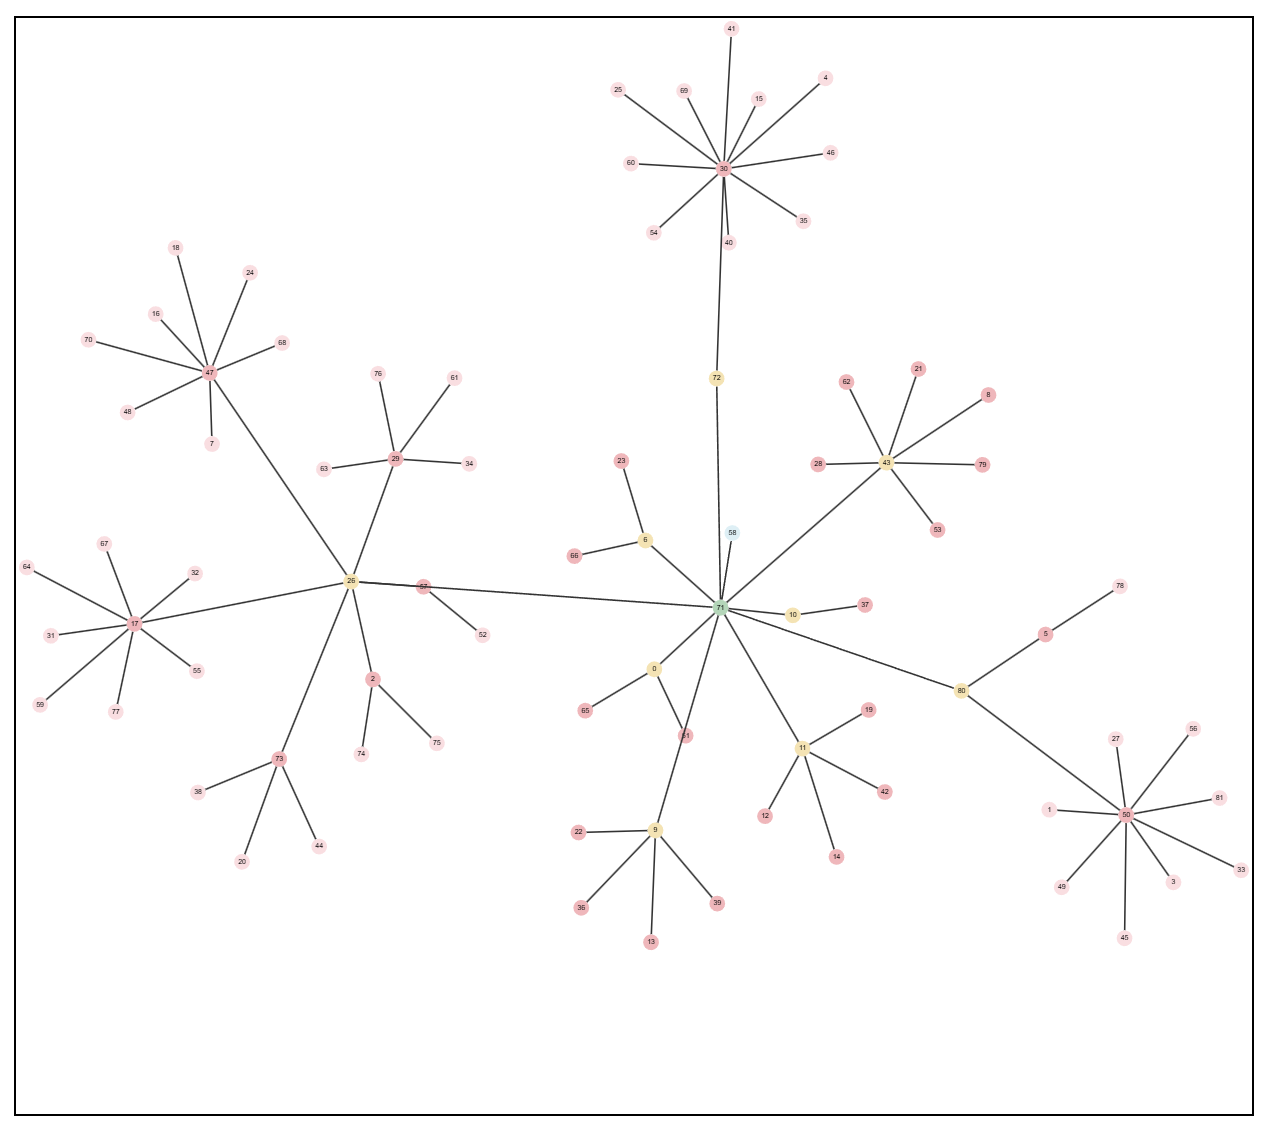
Force-directed layouts are a class of graph drawing algorithms that position nodes in a graph by simulating physical forces. The algorithm treats nodes as particles and edges as springs, automatically calculating optimal positions by balancing attractive forces (pulling connected nodes together) and repulsive forces (pushing unconnected nodes apart).
This approach results in layouts that:
- Minimize edge crossings for better readability
- Maximize visual clarity and node separation
- Reveal natural clusters and relationships
- Adapt dynamically to data structure changes
Key Features
Physics-Based Simulation
At the core of this solution is a sophisticated physics simulation engine. The algorithm continuously calculates forces between nodes and updates their positions in real-time, creating smooth animations as the layout evolves and stabilizes.
// Example: Force-directed layout configuration
const layoutConfig = {
  nodeRepulsion: 1000, // Repulsive force between nodes
  edgeLength: 150, // Preferred edge length
  gravity: 0.1, // Gravity force pulling nodes to center
  damping: 0.9, // Damping factor for smooth animation
  iterations: 300, // Number of simulation iterations
};
Automatic Layout Optimization
Unlike static layouts, force-directed algorithms adapt dynamically to your data structure. The simulation automatically reveals patterns, hierarchies, and relationships that might not be obvious in manually arranged diagrams.
Interactive Node Dragging
Users can drag nodes to reposition them while the algorithm automatically adjusts surrounding nodes to maintain optimal layout balance. This provides both manual control and automatic optimization.
Zoom & Pan Controls
Smooth zoom and pan controls allow users to explore large graphs with thousands of nodes while maintaining performance. The layout algorithm scales efficiently to handle complex networks.
Node Clustering
The solution automatically detects and visualizes node clusters based on connection density and graph structure, making it easy to identify groups and communities in your data.
Implementation Details
Force Calculation
The force-directed algorithm calculates several types of forces:
- Node Repulsion: Pushes unconnected nodes apart to prevent overlap
- Edge Attraction: Pulls connected nodes together based on edge length
- Gravity: Optional force pulling nodes toward the center
- Damping: Reduces node velocity for smooth convergence
// Example: Force calculation
function calculateForces(nodes, edges) {
  nodes.forEach(node => {
    let fx = 0,
      fy = 0;

    // Repulsion from other nodes
    nodes.forEach(other => {
      if (node.id !== other.id) {
        const dx = node.x - other.x;
        const dy = node.y - other.y;
        const distance = Math.sqrt(dx * dx + dy * dy);
        const force = nodeRepulsion / (distance * distance);
        fx += (dx / distance) * force;
        fy += (dy / distance) * force;
      }
    });

    // Attraction along edges
    edges.forEach(edge => {
      if (edge.source === node.id || edge.target === node.id) {
        const targetNode = nodes.find(
          n => n.id === (edge.source === node.id ? edge.target : edge.source)
        );
        const dx = targetNode.x - node.x;
        const dy = targetNode.y - node.y;
        const distance = Math.sqrt(dx * dx + dy * dy);
        const force = (distance - preferredEdgeLength) * edgeStrength;
        fx += (dx / distance) * force;
        fy += (dy / distance) * force;
      }
    });

    // Update node velocity and position
    node.vx = (node.vx + fx) * damping;
    node.vy = (node.vy + fy) * damping;
    node.x += node.vx;
    node.y += node.vy;
  });
}
Performance Optimization
For large graphs, the solution includes several performance optimizations:
- Spatial Indexing: Uses quadtree or grid-based spatial indexing to reduce force calculations
- Barnes-Hut Approximation: Approximates distant node forces for faster computation
- Incremental Updates: Only recalculates forces for affected nodes when dragging
- Web Workers: Offloads heavy calculations to background threads
Use Cases
Social Network Analysis
Visualize social networks with automatic detection of communities, influencers, and connection patterns. The force-directed layout naturally groups related individuals and reveals network structure.
Organizational Charts
Generate organizational charts automatically from hierarchical data. The algorithm arranges departments, teams, and individuals in a clear, readable structure.
Dependency Graphs
Visualize software dependencies, package relationships, or system architectures. The layout automatically reveals dependency chains and circular dependencies.
Knowledge Mapping
Create knowledge maps showing relationships between concepts, topics, and ideas. The clustering reveals conceptual groups and learning paths.
System Architecture Diagrams
Visualize complex system architectures with automatic positioning of components, services, and their interconnections.
Benefits
- Automatic Optimization: Save hours of manual layout work with automatic positioning
- Pattern Discovery: Reveal hidden patterns and relationships in complex data
- Scalability: Handle large graphs with thousands of nodes efficiently
- Interactivity: Explore graphs dynamically with smooth animations
- Professional Quality: Create presentation-ready visualizations for reports and dashboards
- Adaptive Layouts: Automatically adjust to data structure changes
Technical Implementation
The solution is built with:
- React: Modern UI framework for interactive components
- TypeScript: Type-safe development for reliability
- ReactFlow: Powerful graph visualization library
- D3.js: Advanced force simulation algorithms
- Canvas API: High-performance rendering for large graphs
- Physics Simulation: Custom force calculation engine
Integration
The Force-Directed Layout solution can be integrated into:
- React and Next.js applications
- Vue and Angular projects
- Standalone visualization dashboards
- Data analysis tools
- Network monitoring systems
Export graphs to JSON, PNG, SVG formats. Import graph data from CSV, JSON, GraphML. Compatible with graph databases like Neo4j and ArangoDB. API available for programmatic graph generation and real-time data updates.
Conclusion
Force-Directed Layout provides a powerful, automatic solution for creating beautiful graph visualizations. By leveraging physics-based algorithms, it eliminates the need for manual node positioning while revealing patterns and relationships that enhance data understanding. Whether you're visualizing social networks, dependencies, or complex relationships, this solution delivers professional results with minimal effort.
Start creating stunning graph visualizations with automatic layout optimization today!