Visualizing Microservices Architectures with React Flow
As modern software moves from monolithic architectures to complex, distributed microservices, the ability to clearly visualize and monitor these systems has never been more critical. DevOps engineers, SREs, and systems architects constantly need ways to diagram cloud infrastructure.
While static tools like Visio or Draw.io are great for planning, React Flow allows you to build dynamic, interactive architecture visualizers that can tie directly into real-time monitoring data.
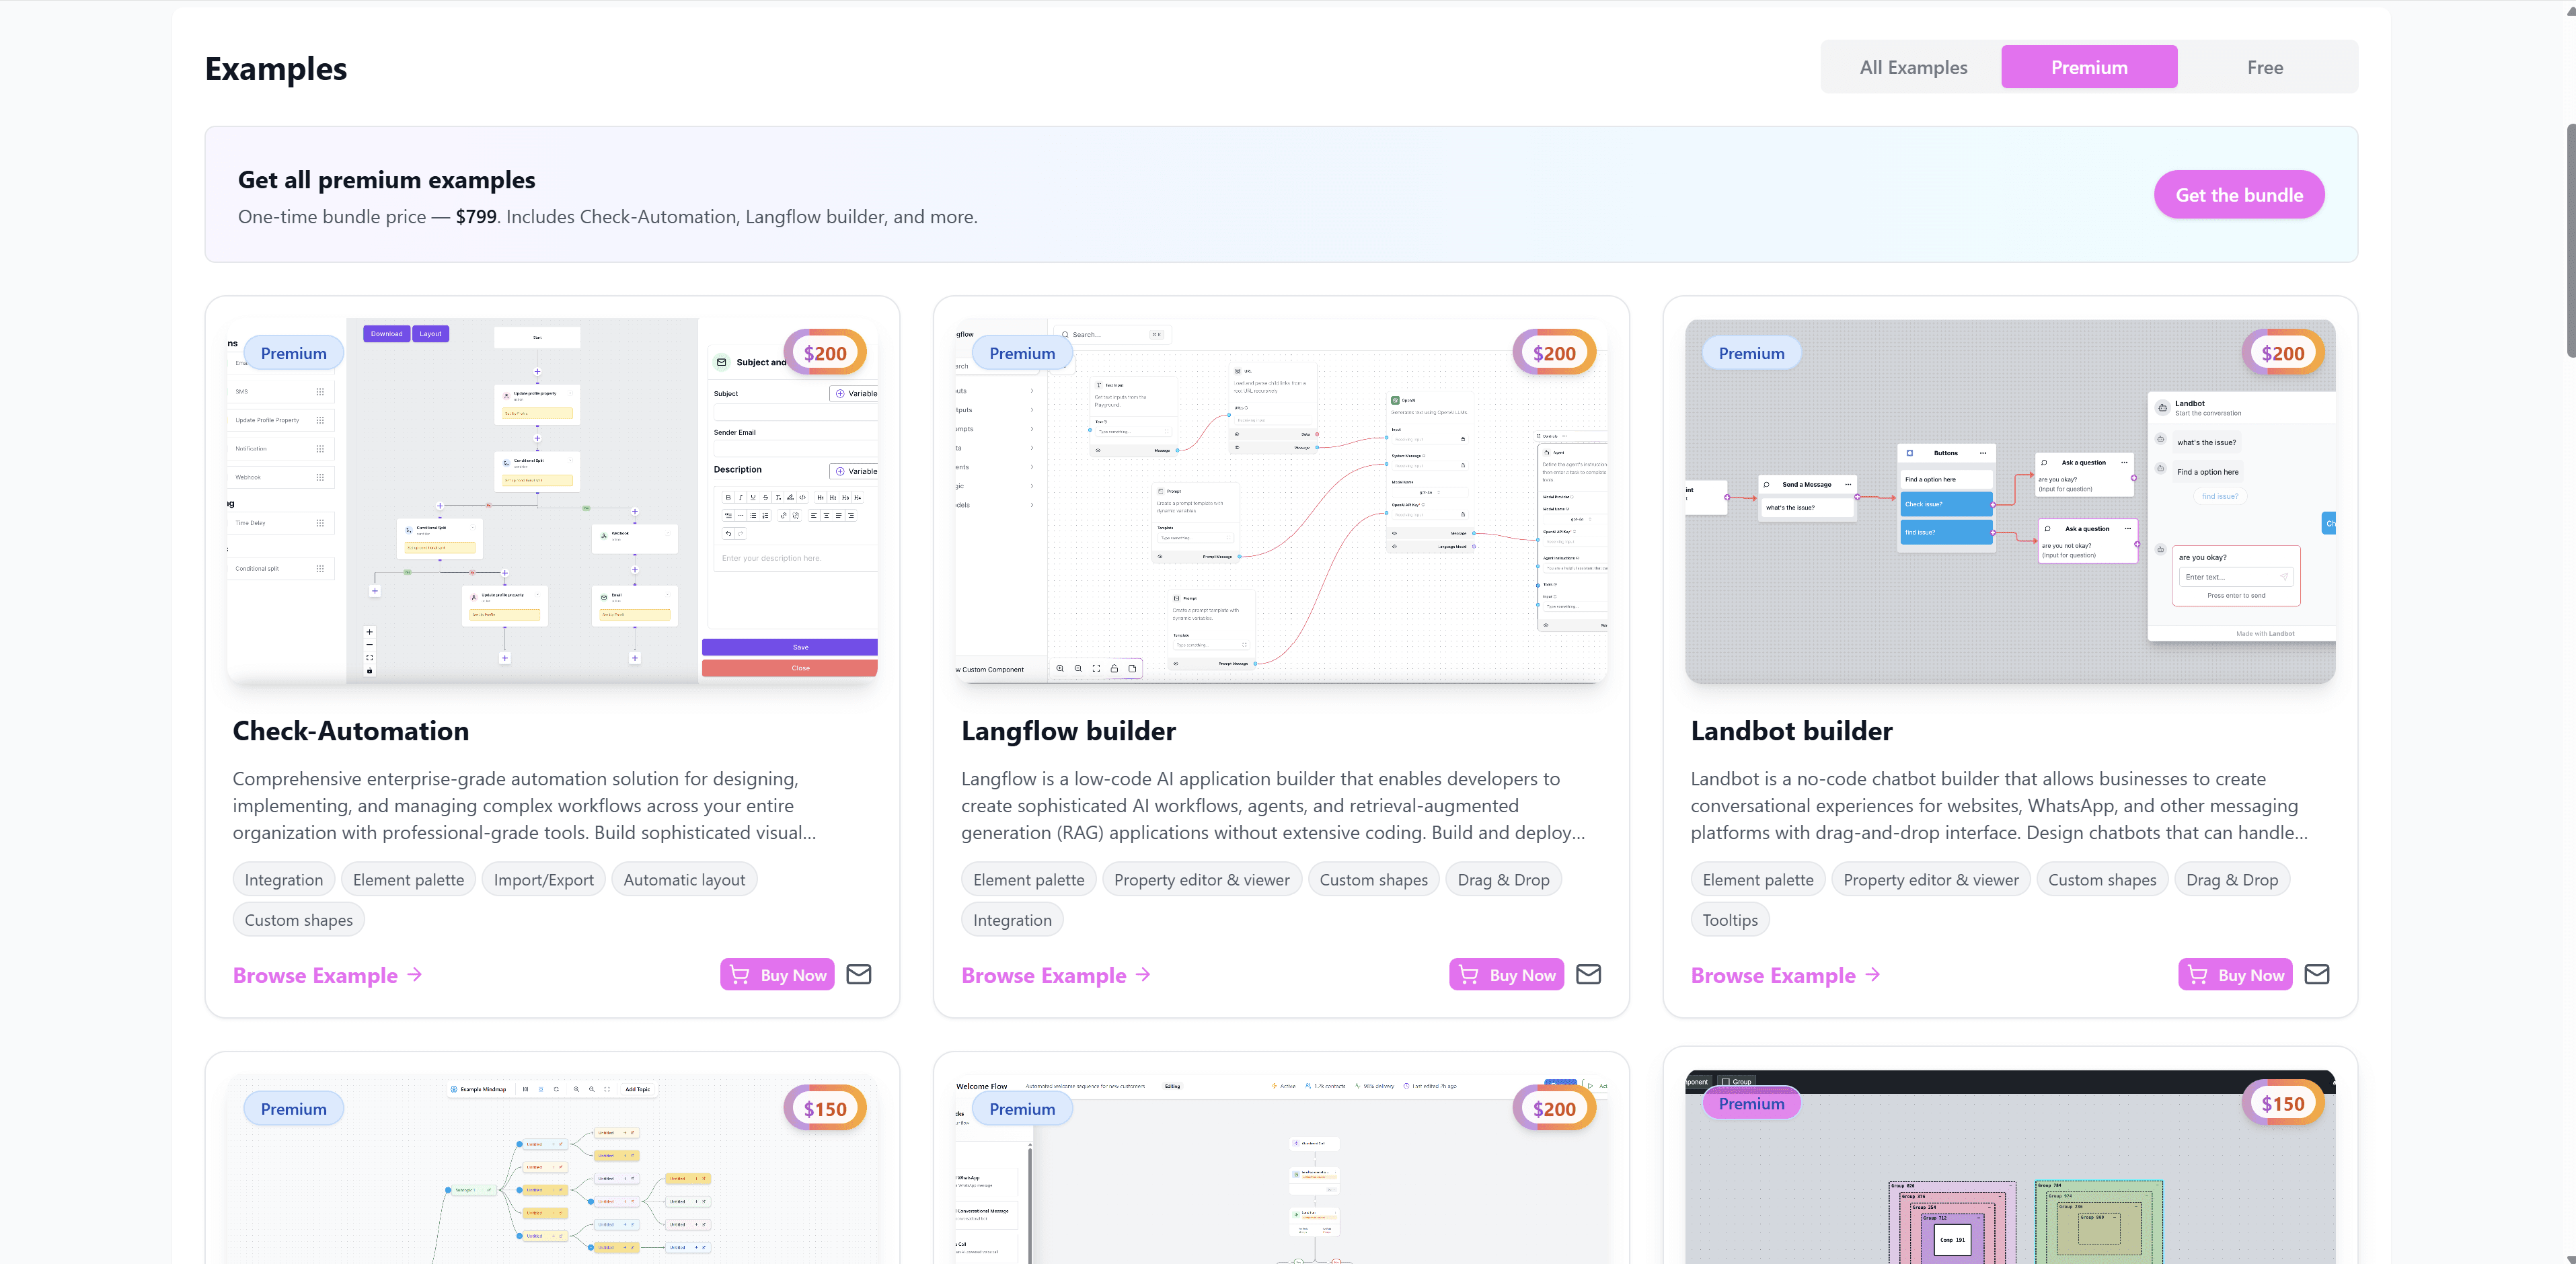
In this post, we'll explore our new Microservices Architecture Visualizer template, a $50 premium template designed to jumpstart your cloud infrastructure dashboard.
Key Challenges in Architecture Visualization
When building a system architecture visualizer, you are not just drawing boxes. You need to convey system health, network traffic, and grouped infrastructure (like VPCs or Kubernetes namespaces).
Key challenges include:
- Differentiating Services: Visually distinguishing between databases, API gateways, external services, and internal microservices.
- Visualizing Traffic: Showing how data flows between services, not just that a connection exists.
- Grouping: Containing microservices within logical clusters (e.g., "Production VPC", "Auth Cluster").
The Microservices Architecture Template
Our premium Microservices Architecture Visualizer template is built specifically for cloud architects and DevOps teams looking to build custom dashboards.
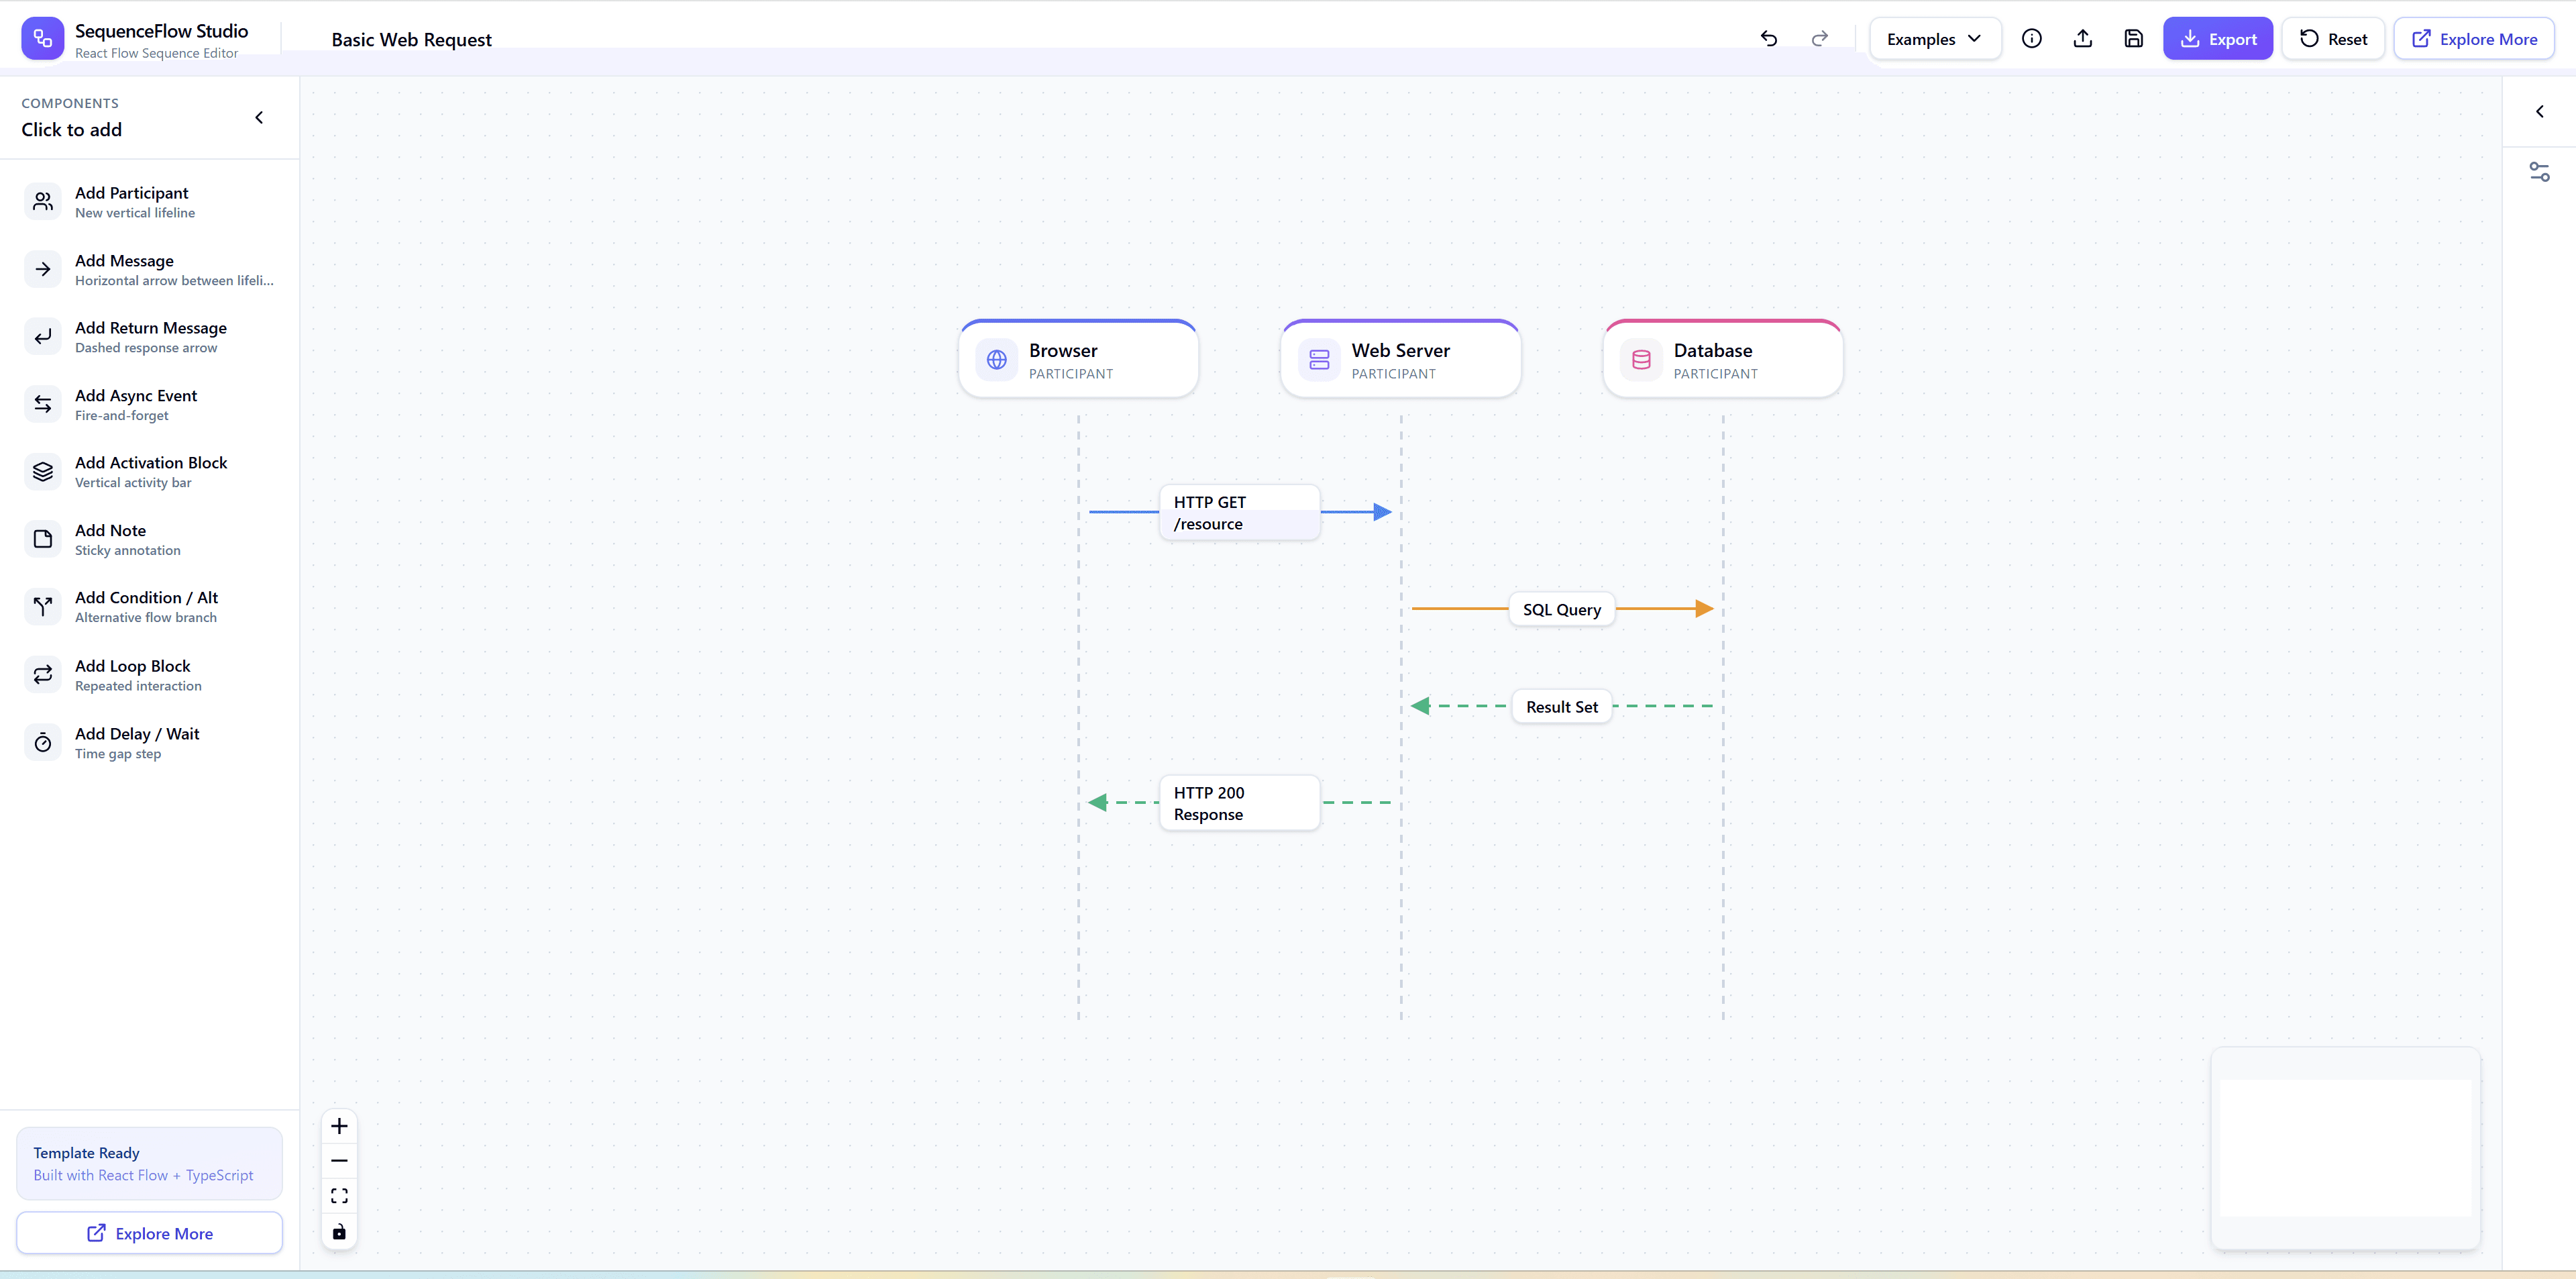
1. Custom Infrastructure Nodes
We've built specialized custom React Flow nodes for different types of infrastructure. Instead of plain rectangles, these nodes feature:
- Modern iconography for Databases, APIs, and Servers.
- Status indicators (e.g., green for healthy, red for degraded).
- Expandable metric details (latency, request rates).
2. Animated Traffic Edges
One of the most requested features in React Flow is animating data flowing along an edge. This template includes custom animated edges that simulate network packets traveling between your microservices.
// A simplified look at how you might style an animated traffic edge
<path
  className="react-flow__edge-path"
  d={edgePath}
  style={{
    stroke: '#3b82f6',
    strokeWidth: 2,
    strokeDasharray: '5, 5',
    animation: 'dashdraw 1s linear infinite'
  }}
/>
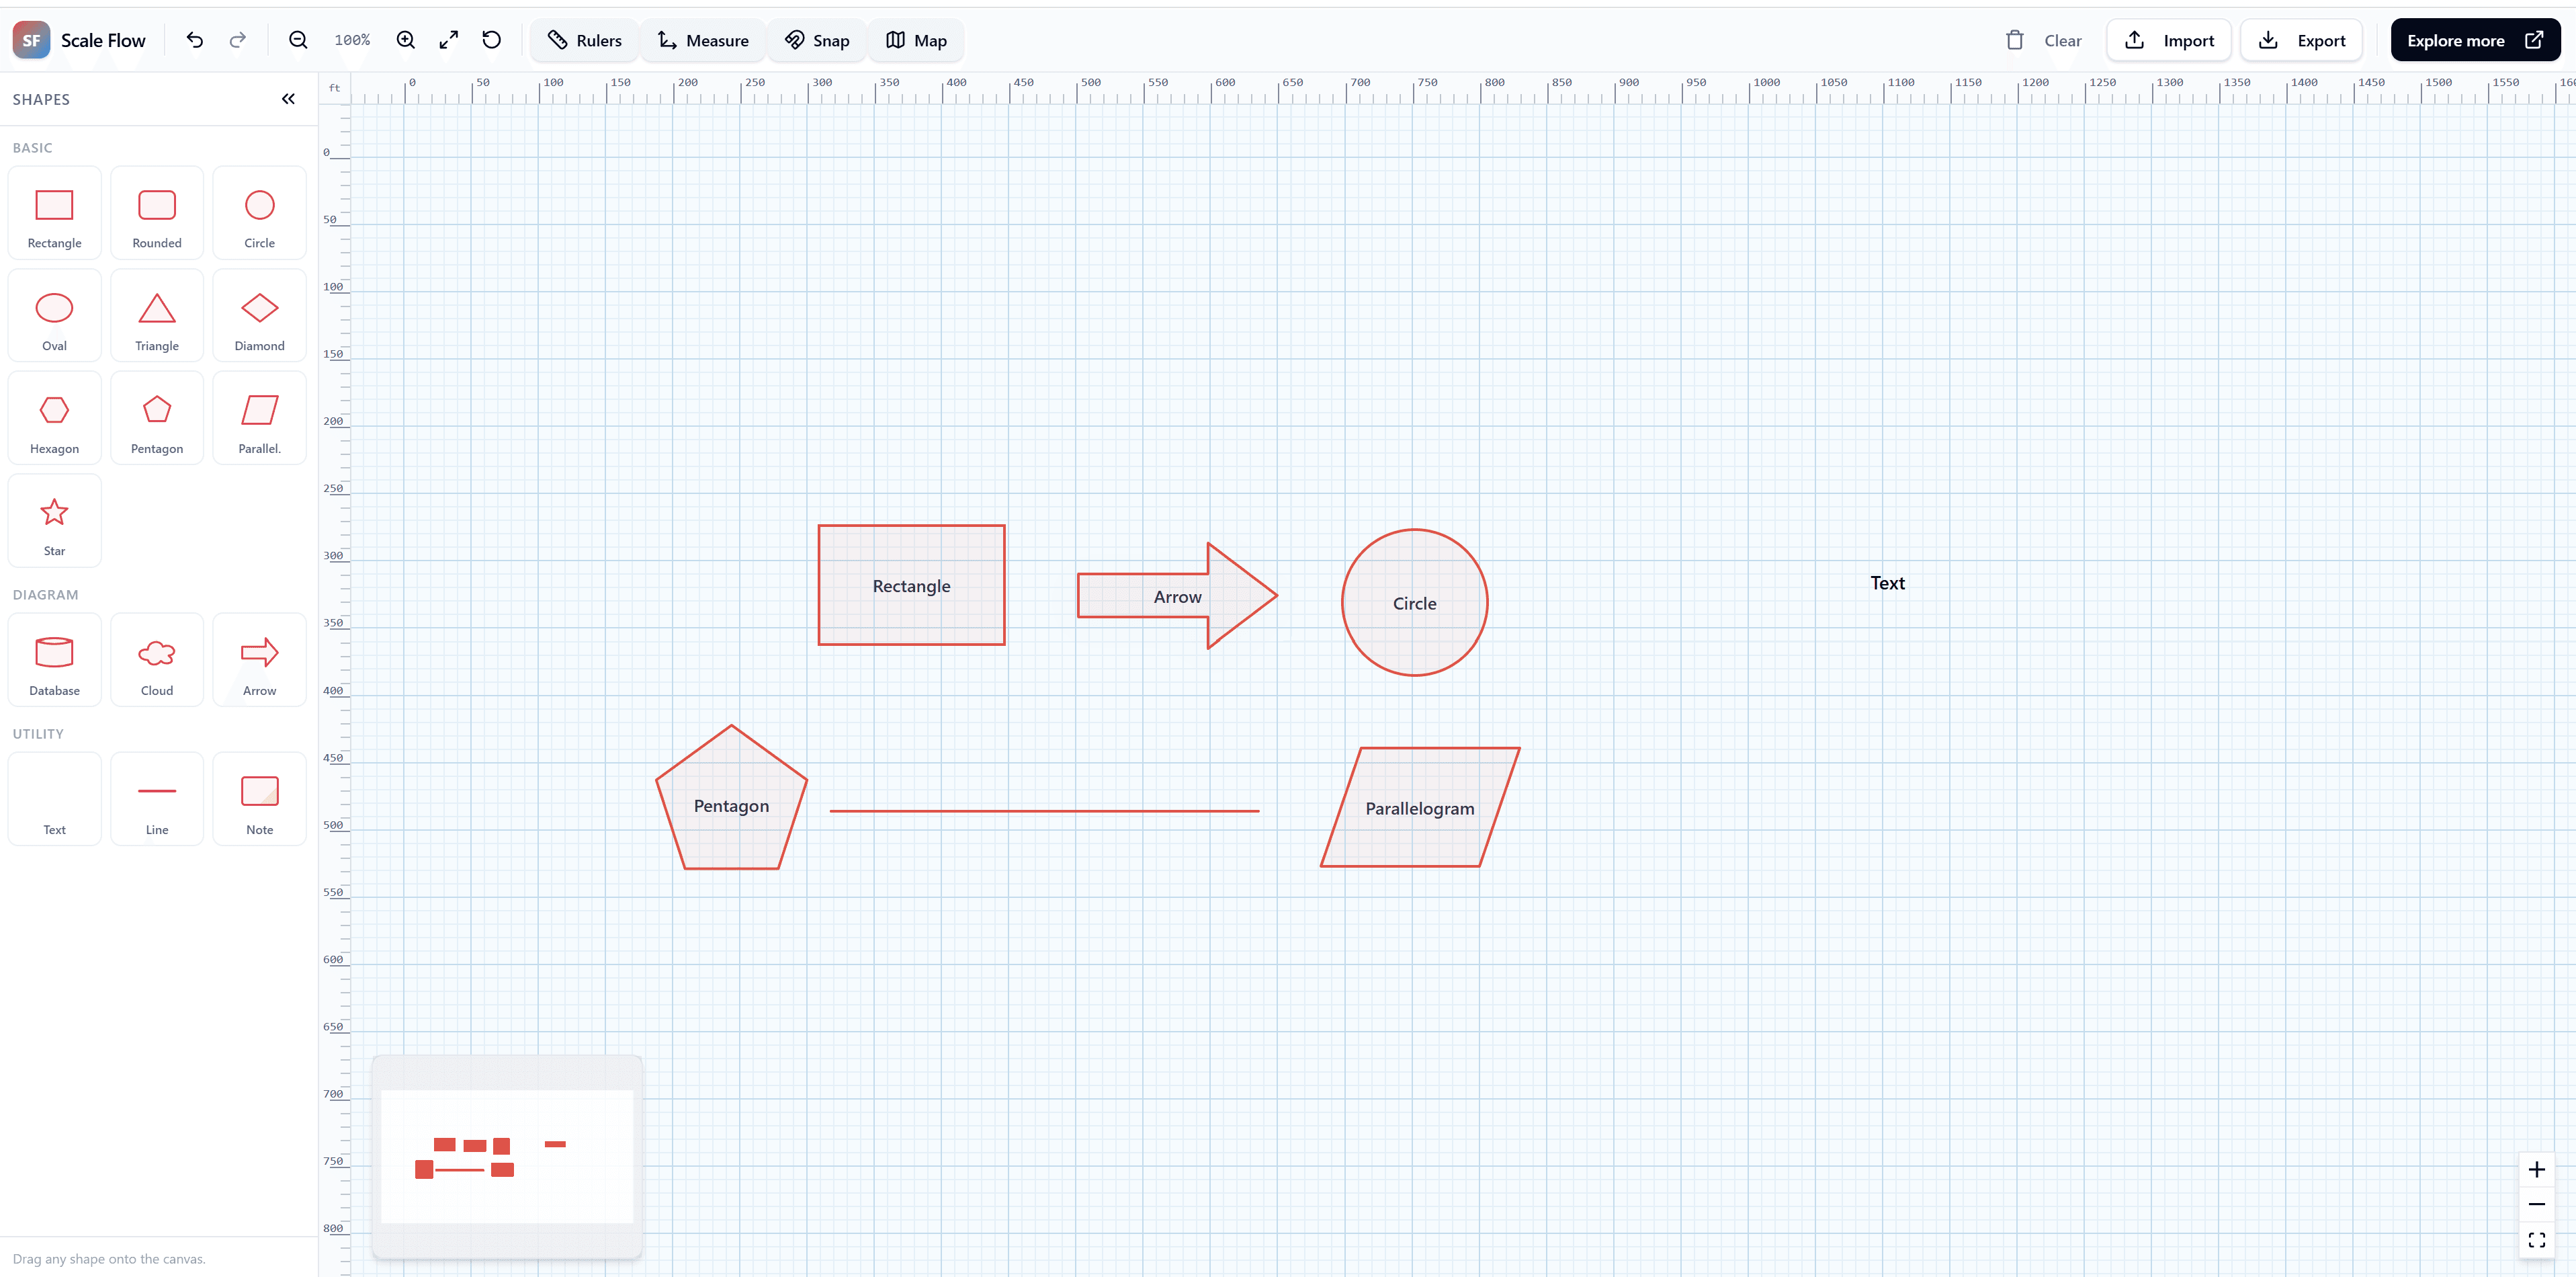
3. Nested Clusters and Subflows
Modern cloud architectures are deeply nested. Using React Flow's parentNode feature, this template demonstrates how to properly group services into clusters (like AWS VPCs or K8s pods) while maintaining clean layout and dragging functionality.
Why Buy the Template?
Building custom animated edges, robust layout grouping, and polished infrastructure nodes takes significant time.
By purchasing the Microservices Architecture template for $50, you get:
- Production-Ready Source Code: Clean, fully typed TypeScript code.
- Advanced Edge Animations: Learn how to create "moving traffic" effects along SVG paths.
- Beautiful Tailwind UI: A sleek, dark-mode ready dashboard layout perfect for DevOps tooling.
View the Live Demo here and start visualizing your cloud infrastructure today!