React Flow Radial Cluster — Organise Complex Data with Interactive Circular Diagrams
Pro
About React Flow Radial Cluster — Organise Complex Data with Interactive Circular Diagrams
React flow Radial Cluster is a visual hierarchy editor designed to organize connected information around a central point.
Radial Cluster — Organise Complex Data with Interactive Circular Diagrams
Not every relationship is best represented by a traditional tree or flowchart.
When information revolves around a central subject, a radial layout can provide a much clearer way to understand how everything connects.
Radial Cluster is a visual hierarchy editor designed to organise connected information around a central point. Instead of arranging every item in a straight vertical or horizontal structure, it presents related elements in circular layers, creating a more balanced and intuitive view of complex relationships.
Whether you're mapping an organisation, exploring connected concepts, visualising dependencies, or building a relationship network, Radial Cluster helps turn complicated structures into clear visual experiences.
Explore Relationships from the Centre Outward
The idea behind radial visualization is simple: start with a central subject and arrange related elements around it.
Each additional level expands outward, allowing users to explore relationships without losing sight of the main topic.
For example, a technology ecosystem could be organised as:
- Technology Ecosystem
- Frontend
- React
- Vue
- Angular
- Backend
- Node.js
- Python
- Java
- Databases
- PostgreSQL
- MongoDB
- MySQL
- Infrastructure
- AWS
- Docker
- Kubernetes
- Frontend
A radial arrangement makes the overall structure easier to scan while showing how individual elements belong to larger categories.
Why Choose Radial Cluster?
1. Understand Complex Hierarchies at a Glance
Traditional tree diagrams can become extremely wide or tall as more branches are added.
Radial layouts offer an alternative by distributing related elements around a central point.
This is particularly helpful when working with information that has multiple levels of parent-child relationships.
2. Make Relationships Easier to Explore
When every element is positioned in relation to a central subject, users can understand the structure more naturally.
It becomes easier to identify:
- The main subject.
- Its immediate relationships.
- Secondary categories.
- Deeper levels of information.
- The overall structure of a connected dataset.
3. Reduce Manual Diagram Arrangement
Positioning dozens of connected nodes manually can be time-consuming.
Radial layout algorithms calculate node positions based on their relationship to the root and their position within the hierarchy.
This provides a more consistent starting layout and reduces repetitive positioning work.
4. Create More Balanced Visualizations
Unlike traditional layouts that extend primarily in one direction, radial arrangements distribute information across multiple directions.
This can make relationship-heavy diagrams more visually balanced and easier to navigate.
5. Build a More Engaging Data Experience
A radial diagram is not just a different way to arrange nodes. It offers a different way to explore information.
Users can focus on the central subject, examine connected categories, and discover how different elements fit into the larger structure.
Real-World Applications
Radial Cluster can be useful in many professional and technical scenarios.
1. Organizational Charts and Company Structures
Visualise a company from its central leadership structure outward to departments, teams, and individual roles.
Example:
- CEO
- Engineering
- Frontend Team
- Backend Team
- Marketing
- Content Team
- Growth Team
- Operations
- Finance
- Human Resources
- Engineering
Real-life benefit: HR professionals and business managers can communicate reporting relationships and understand how different teams connect within an organisation.
2. Software Dependency Mapping
Modern applications depend on many packages, modules, services, and external libraries.
A radial diagram can represent a central application or package and show its dependencies in surrounding layers.
Example:
- Main Application
- Authentication
- API Client
- Database Layer
- UI Components
- Utility Packages
Real-life benefit: Developers can explore dependencies, understand component relationships, and communicate how different parts of a software project are organised.
3. Knowledge Maps and Research Exploration
Researchers and students often work with a central topic connected to many supporting concepts.
A radial structure can help organise these ideas into meaningful groups.
Example:
- Artificial Intelligence
- Machine Learning
- Supervised Learning
- Unsupervised Learning
- Deep Learning
- CNN
- RNN
- Transformers
- Natural Language Processing
- Computer Vision
- Machine Learning
Real-life benefit: Students, researchers, and educators can organise large collections of concepts and make relationships easier to understand.
4. Network Topology and Infrastructure
IT professionals often need to understand how servers, devices, and infrastructure components connect.
A radial arrangement can place a central server or network hub at the centre, with connected devices and secondary network components around it.
Real-life benefit: Infrastructure teams can use a visual representation to explain network relationships, plan connected systems, and document technical environments.
5. Social and Relationship Networks
Social platforms, communities, and relationship analysis tools often involve connections between people or entities.
A radial structure can place one person or entity at the centre and organise related connections into surrounding layers.
Example:
- Central User
- Direct Connections
- Shared Connections
- Community Groups
- Professional Network
- Interest Groups
- Direct Connections
Real-life benefit: Analysts and product teams can explore connections and understand how relationships are distributed across a network.
6. Business Ecosystem Visualization
Businesses often depend on interconnected products, partners, suppliers, departments, and services.
A radial diagram can help represent these relationships around a central business or product.
Real-life benefit: Business analysts and strategic planners can communicate complex ecosystems in a format that is easier to understand and present.
How Radial Cluster Makes Work Easier
Traditional approachWith Radial Cluster
Large trees become difficult to navigate
Relationships are distributed around a central point
Manual node positioning takes time
Radial algorithms calculate node positions
Important relationships can get lost in long branches
The central subject remains visually prominent
Complex structures require lengthy explanations
Hierarchies become easier to explore visually
Large diagrams can feel unbalanced
Circular arrangements distribute information across the canvas
The biggest advantage is perspective. Instead of viewing a hierarchy as a long list of branches, users can understand it as a connected structure organised around a central idea.
Who Should Use Radial Cluster?
Frontend developers — Build interactive radial graph visualizations and hierarchical interfaces.
Software architects — Explore application dependencies, modules, and connected services.
Data analysts — Present relationship-based datasets in a more understandable format.
Researchers and students — Organise knowledge, concepts, and research topics.
HR professionals — Visualise organizational structures and reporting relationships.
IT professionals — Represent network topology and infrastructure relationships.
Product designers — Create intuitive visual experiences for exploring connected information.
Why Buy Radial Cluster from VisualFlow?
Building a radial visualization from scratch involves more than positioning nodes in a circle.
Developers need to consider graph traversal, hierarchy depth, angular distribution, node positioning, spacing, and the relationship between the data structure and its visual representation.
These challenges can take considerable development time, especially when building a reusable visualization component.
Radial Cluster gives developers a practical starting point for creating circular and hierarchical graph experiences with React Flow.
Instead of implementing the entire layout foundation from the beginning, you can study the example, understand its structure, and adapt the implementation to your application.
It is particularly valuable if you're:
- Developing a radial mind map or knowledge explorer.
- Building organizational and relationship visualization tools.
- Creating dependency graph applications.
- Developing interactive network diagrams.
- Exploring alternative graph layouts for React Flow.
- Building SaaS products that need hierarchical data visualization.
You can focus more of your development effort on your application's data, interactions, and user experience rather than starting every layout implementation from scratch.
Related Blueprints
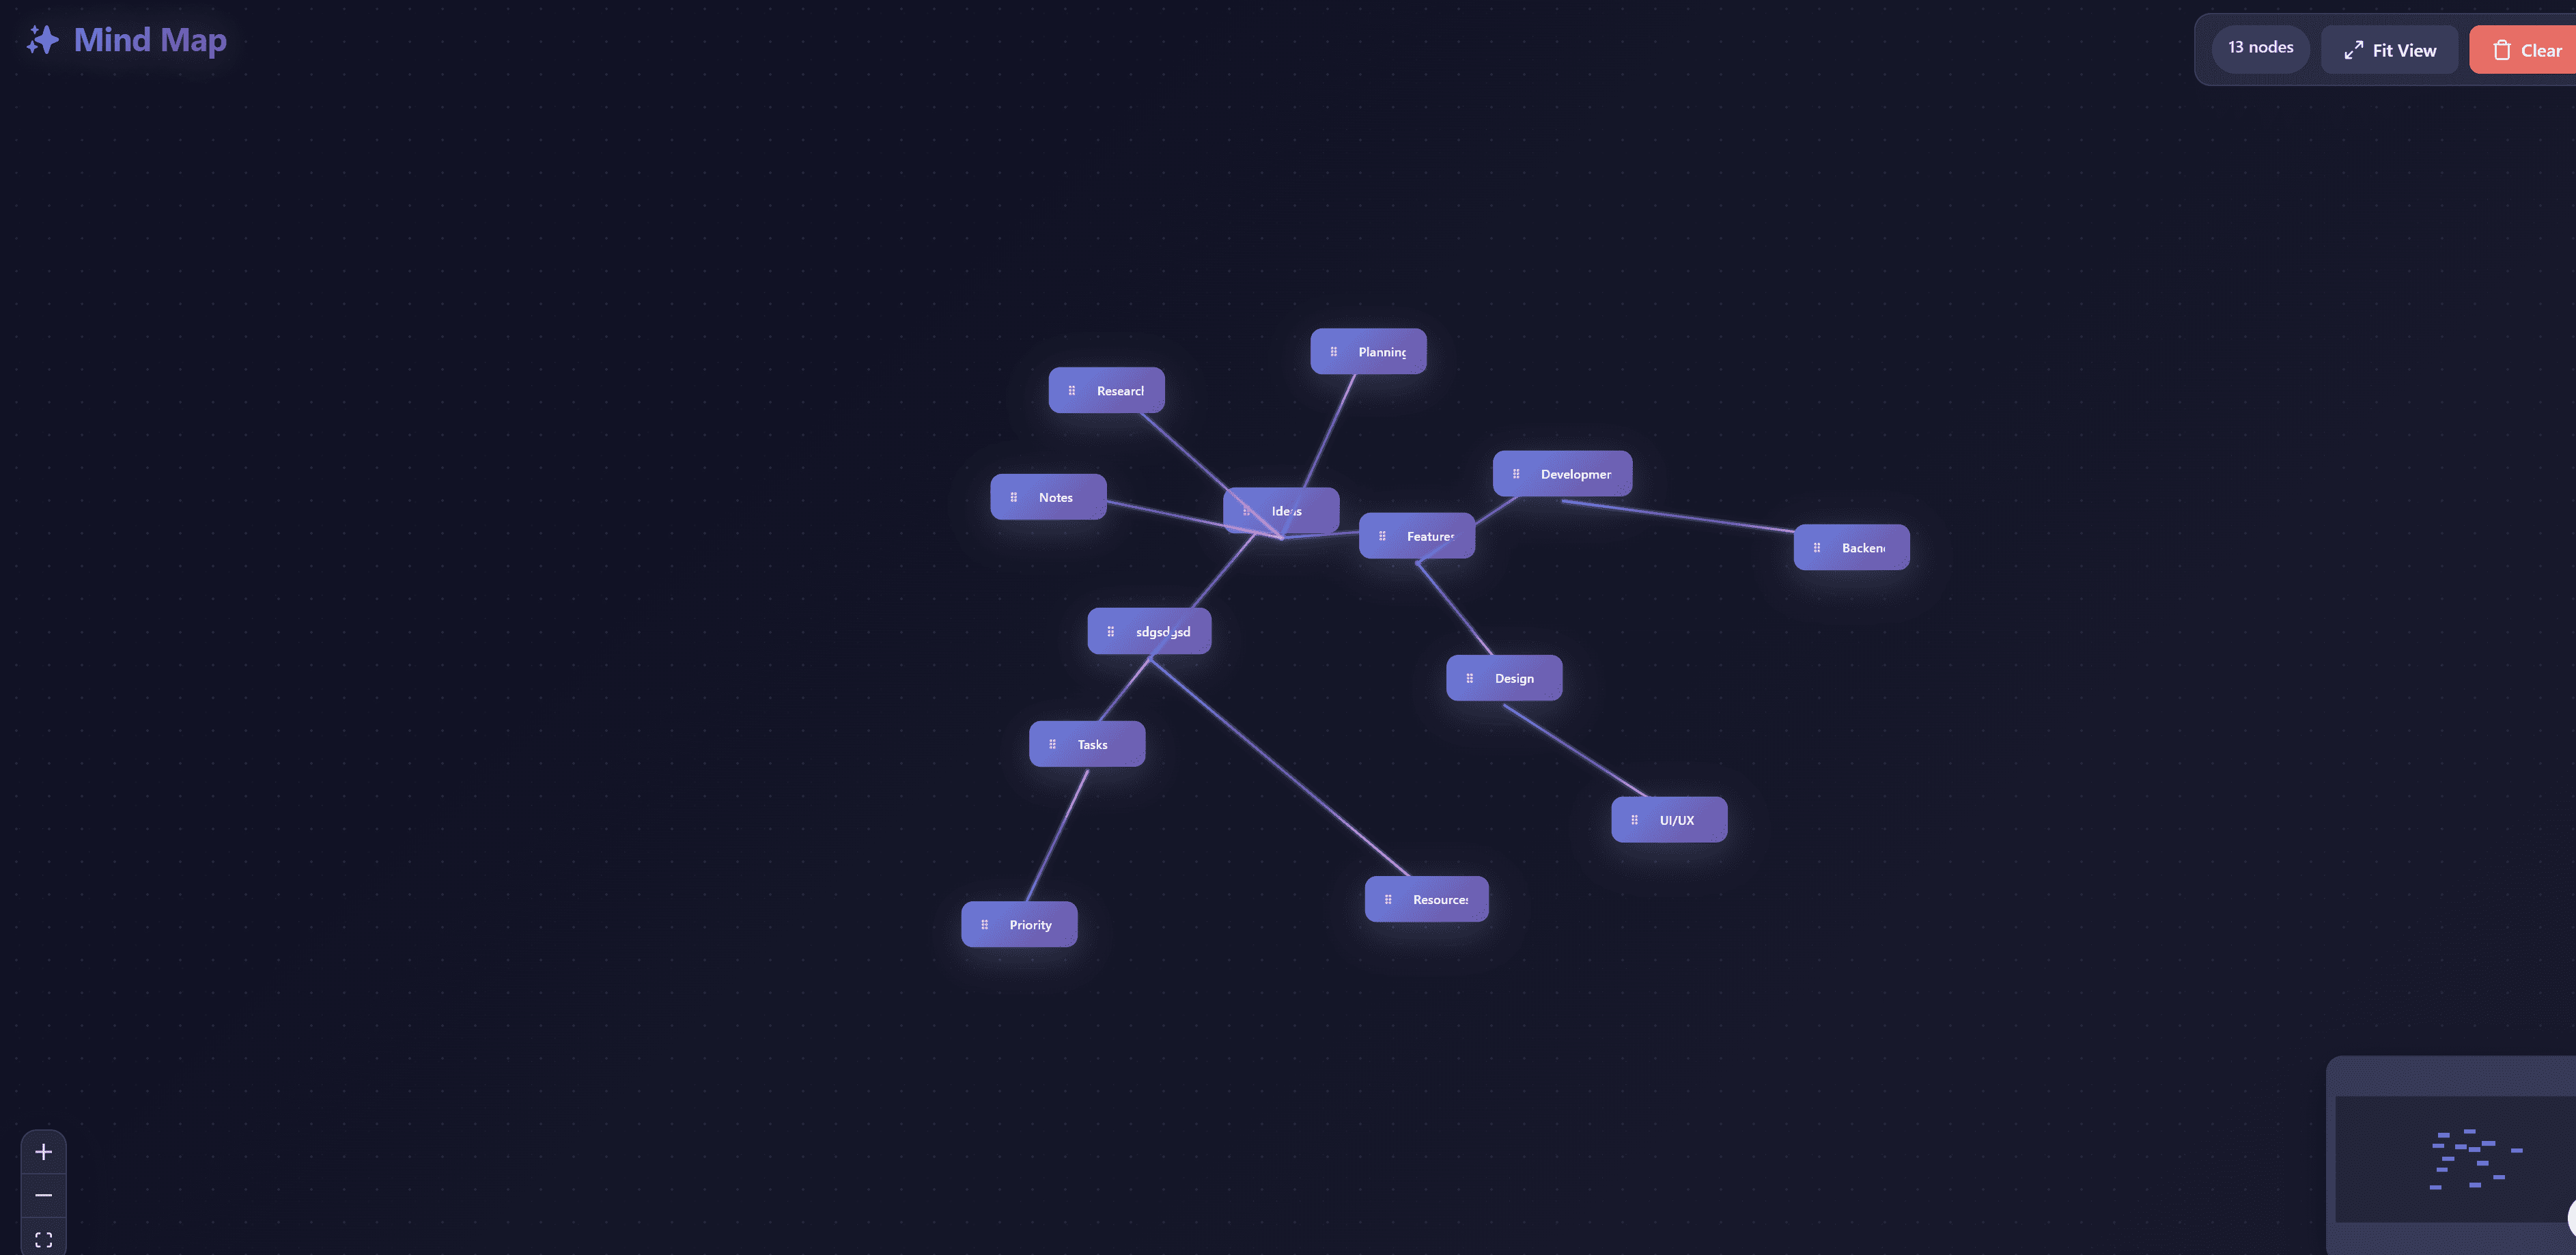
React flow concept map
Interactive concept mapping tool for organizing knowledge and visualizing relationships between ideas. Create hierarchical concept maps with drag-and-drop nodes, custom connections, and rich text editing. Perfect for education, research, brainstorming, and knowledge management with intuitive interface for building complex conceptual relationships.
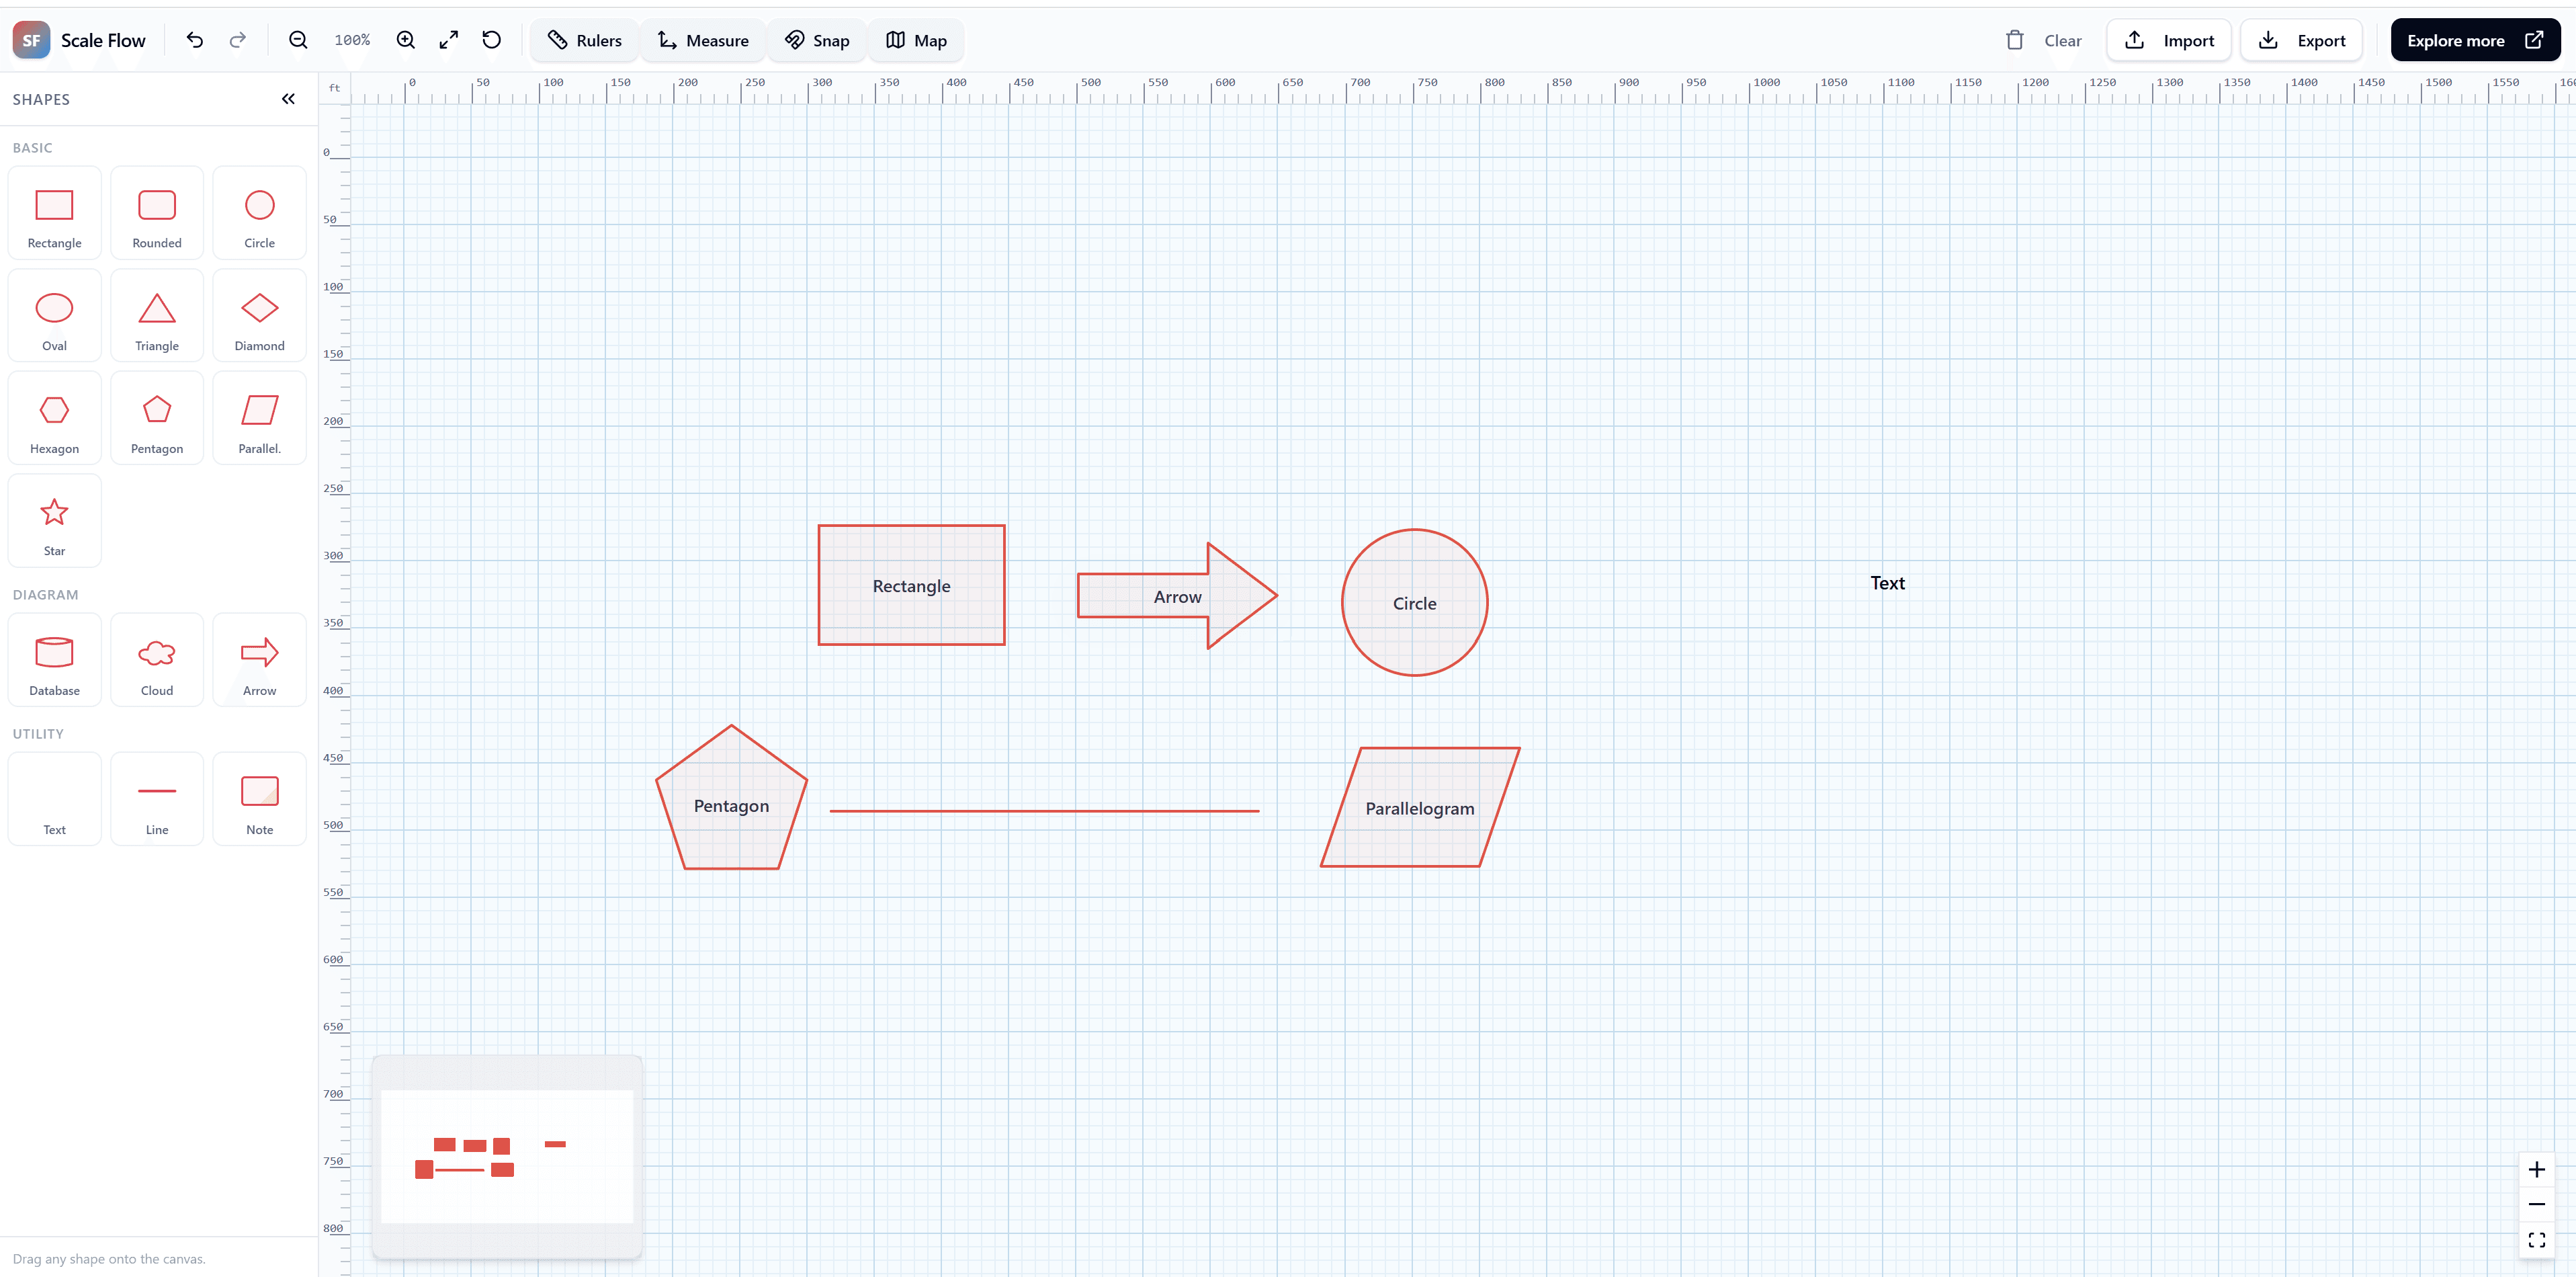
Scale Studio Pro Enterprise with React flow
An enterprise-grade, massive scale diagramming studio built with React Flow. Engineered for performance with thousands of nodes, advanced minimap navigation, and high-fidelity zoom.
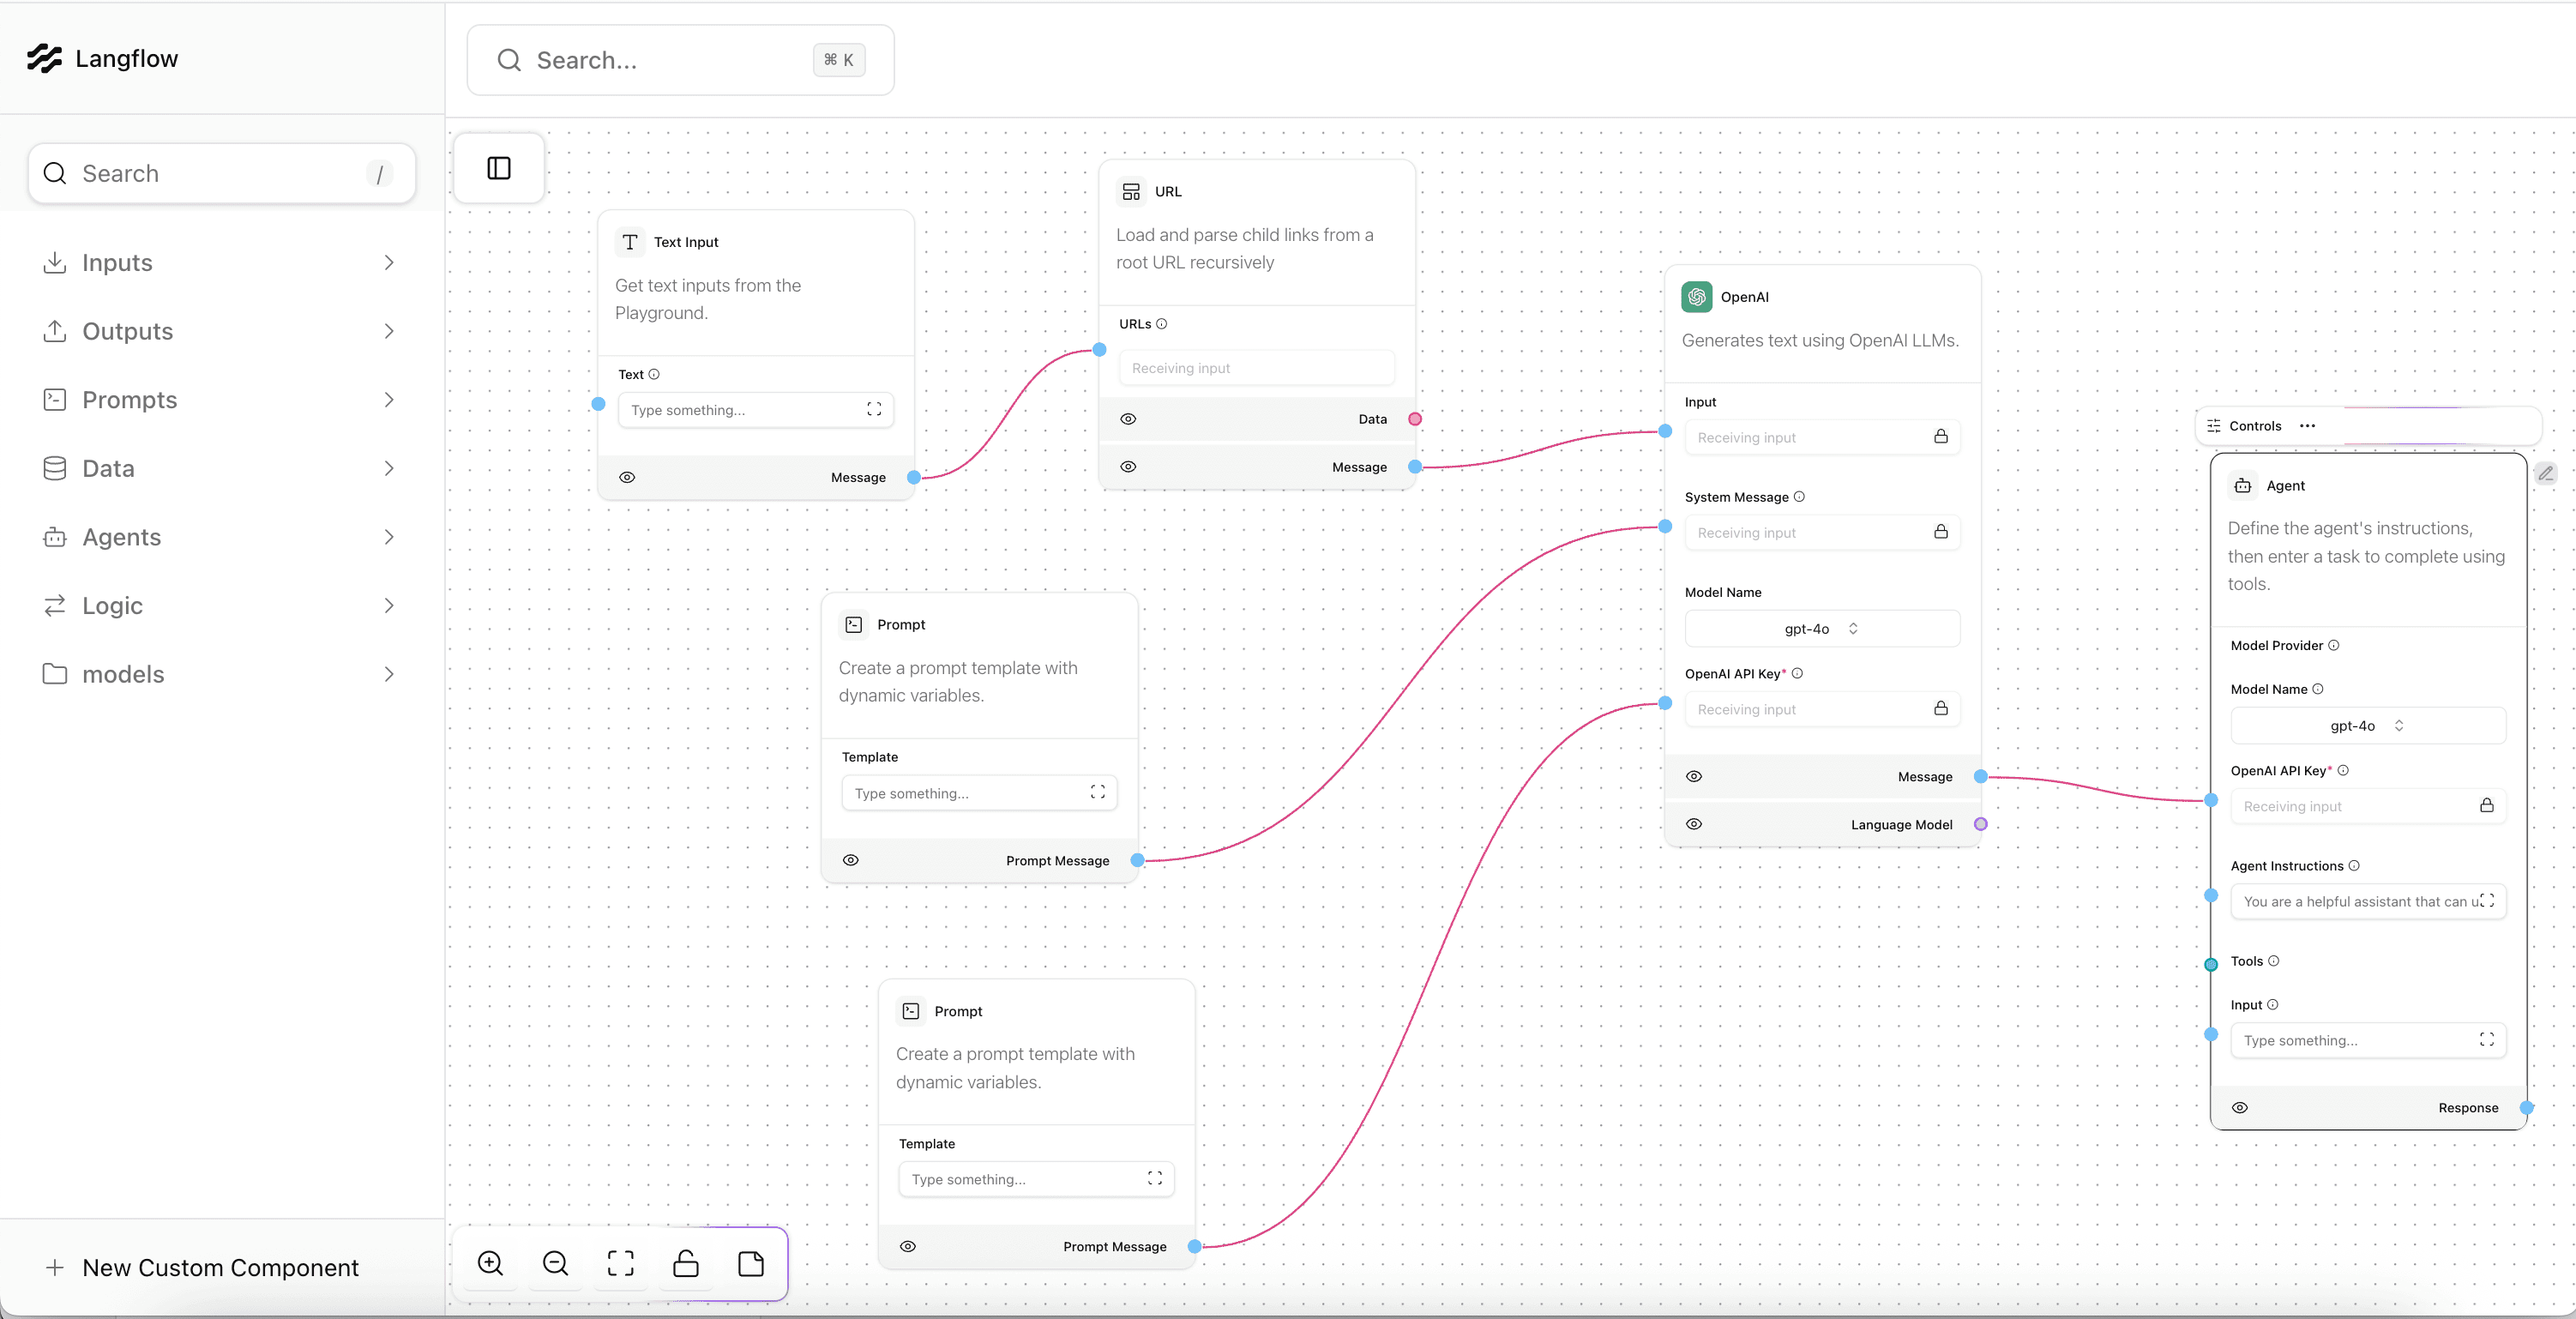
React flow Langflow builder
Langflow is a low-code AI application builder that enables developers to create sophisticated AI workflows, agents, and retrieval-augmented generation (RAG) applications without extensive coding. Build and deploy LLM-powered applications through intuitive visual interface with support for all major large language models, vector databases, and growing library of AI tools. Features prompt templating, model comparison, vector database integration, and production deployment tools for building AI chatbots, content generation systems, and complex reasoning agents.