React flow Multi-Color Graph
$39
About React flow Multi-Color Graph
Beautiful multi-color graph visualization with customizable node colors, edge styling, and theme support. Create vibrant, visually distinct network diagrams with color-coded nodes for categories, status, or data attributes. Features advanced color management, gradient edges, and interactive color pickers for creating professional, eye-catching visualizations that make complex data easy to understand.
Multi-Color Graph Visualization is a sophisticated solution for creating vibrant, visually distinct network diagrams with advanced color management capabilities. This tool enables you to color-code nodes based on categories, status, data attributes, or any custom classification system, making complex graphs immediately understandable at a glance.
The power of color in data visualization cannot be overstated. Different colors help users quickly identify patterns, group related nodes, distinguish between node types, and understand data relationships without reading labels. This solution provides comprehensive color management tools including predefined color palettes, custom color schemes, gradient support, and interactive color pickers.
Each node can be assigned colors based on its properties, allowing for dynamic color coding that reflects real-time data changes. The system supports multiple color assignment strategies including category-based coloring, status-based coloring, value-based gradients, and custom color mapping. Edges can also be styled with colors and gradients to represent different relationship types or connection strengths.
The solution includes several built-in color themes optimized for different use cases including accessibility-focused palettes, vibrant themes for presentations, and professional themes for reports. Users can also create and save custom color schemes that match their brand or project requirements. The interactive color picker allows real-time color adjustments with immediate visual feedback.
Key Features & Capabilities
Target Use Cases
- •Category-based data visualization
- •Status tracking and monitoring dashboards
- •Multi-dimensional data exploration
- •Branded visualizations with custom color schemes
- •Accessibility-focused color palettes
- •Presentation-ready colorful diagrams
Architecture & Technologies
Related Blueprints
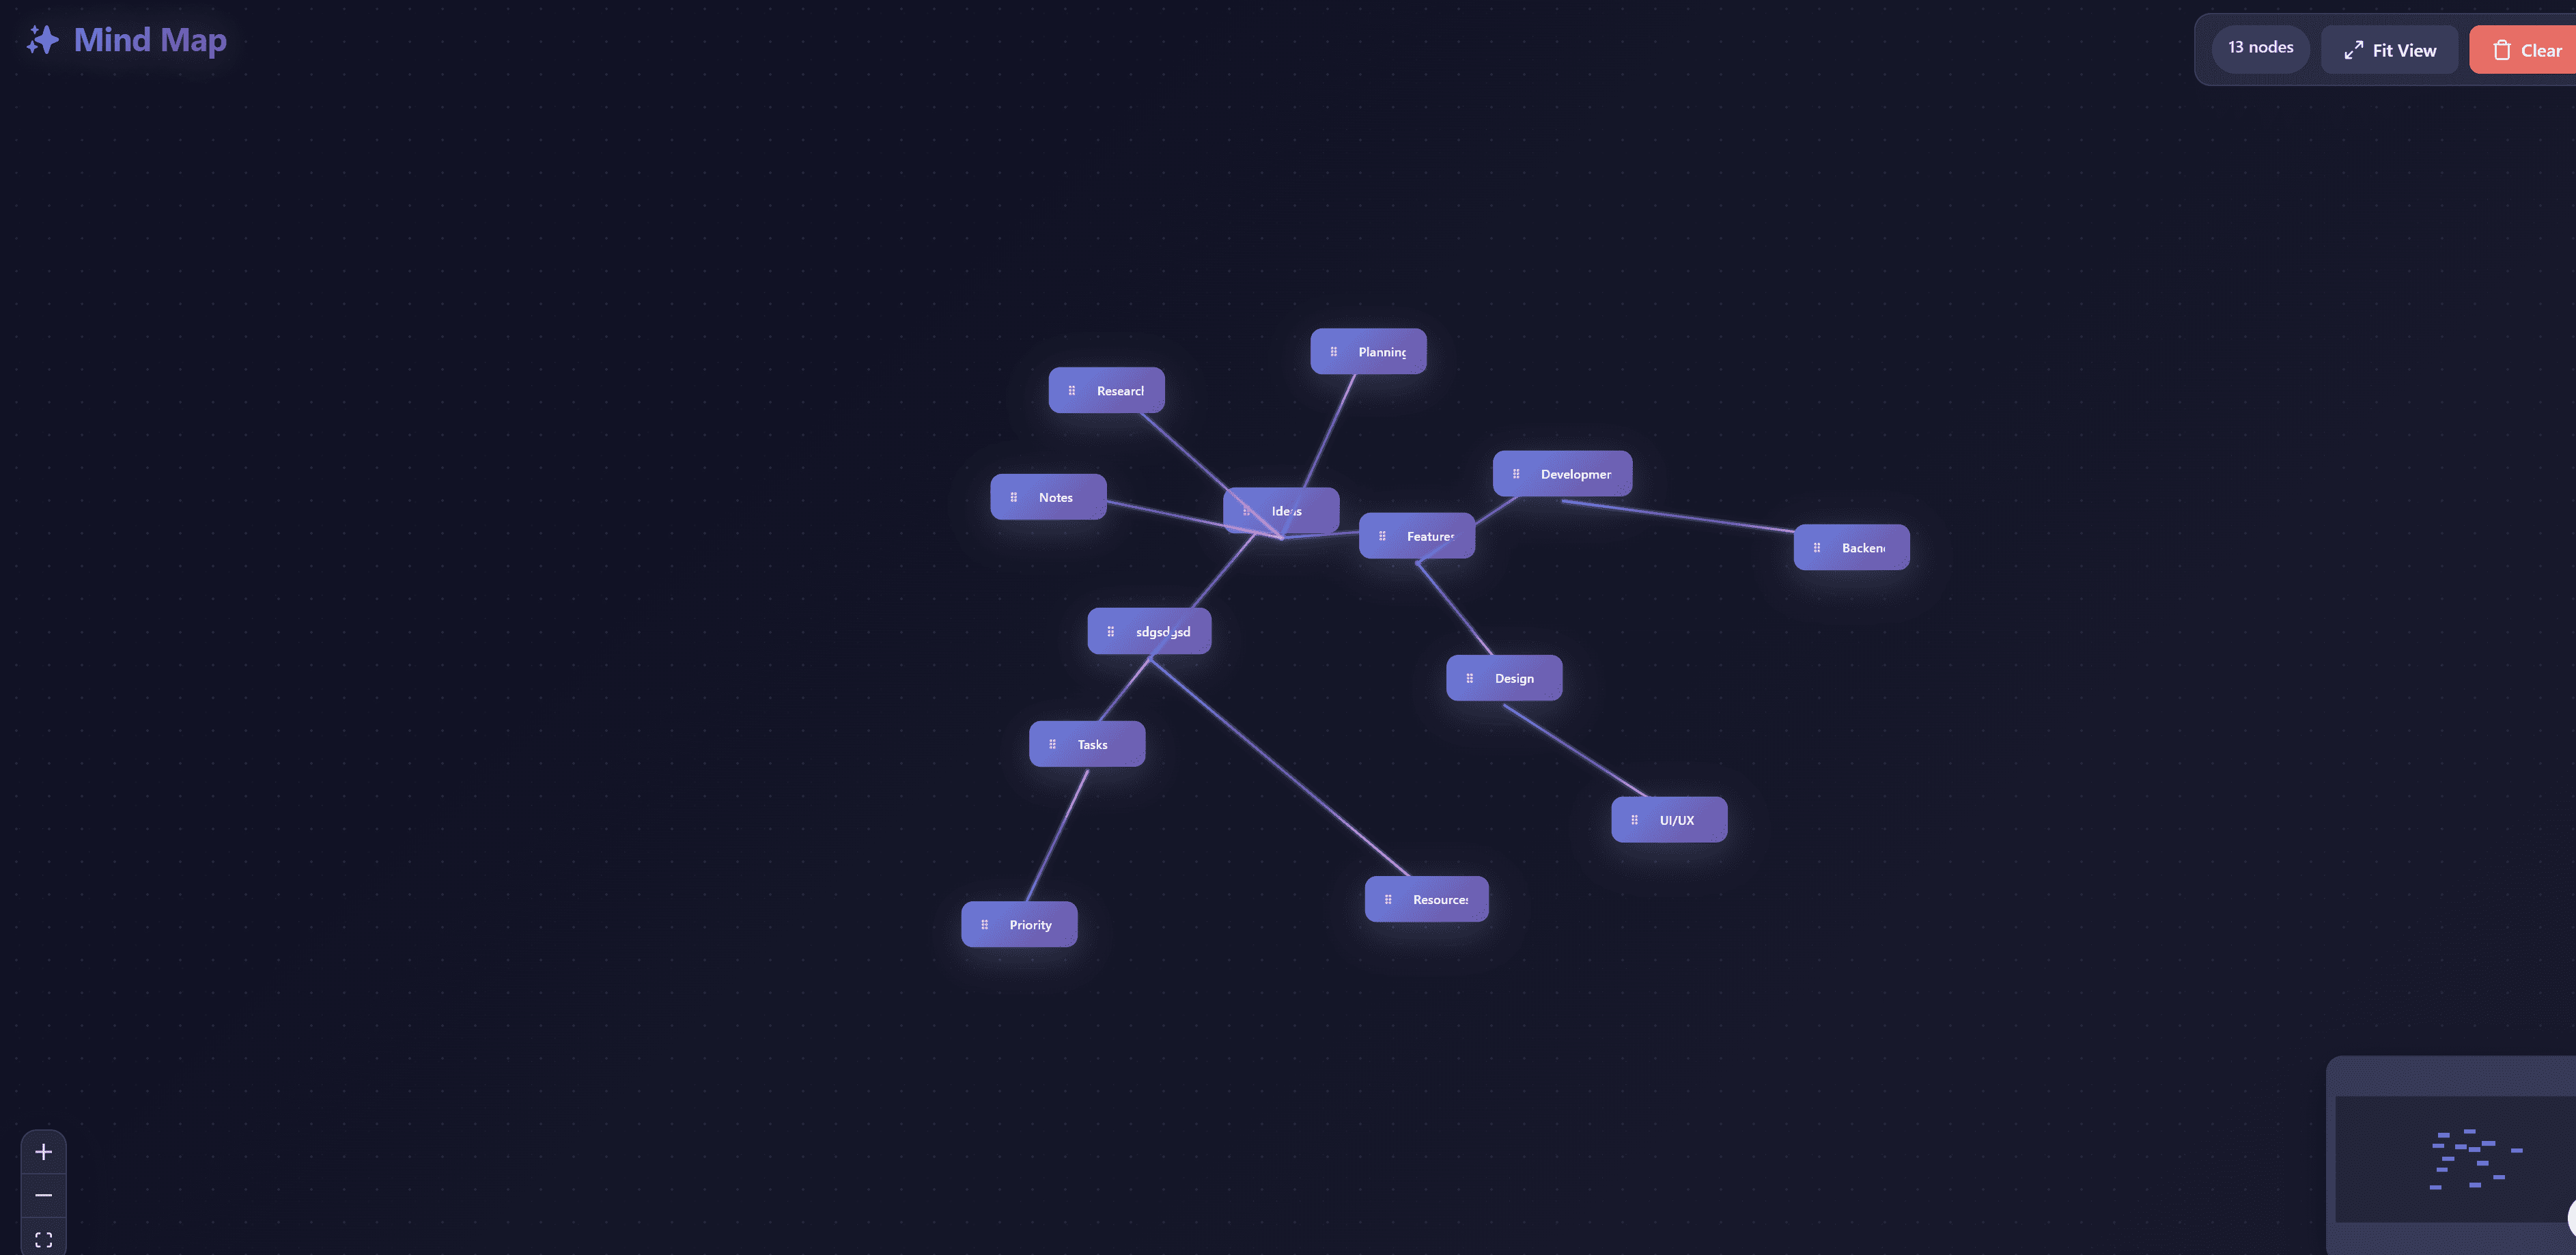
React flow concept map
Interactive concept mapping tool for organizing knowledge and visualizing relationships between ideas. Create hierarchical concept maps with drag-and-drop nodes, custom connections, and rich text editing. Perfect for education, research, brainstorming, and knowledge management with intuitive interface for building complex conceptual relationships.

React flow Kanban Pattern
A free example demonstrating how to build a Kanban board interface using React Flow. Easily visualize and manage tasks across different stages.

React flow State Machine
A free example demonstrating how to visualize state machines and state transitions using React Flow.