React Flow Fishbone Diagram Builder: Visualize Root Cause Analysis Interactively
Pro
About React Flow Fishbone Diagram Builder: Visualize Root Cause Analysis Interactively
A powerful interactive data analysis and visualization flow builder using React Flow. Connect data sources, apply transformations, and visualize results seamlessly.
A React Flow Fishbone Diagram Builder helps teams visualize, organize, and analyze the root causes of complex problems through an interactive Ishikawa diagram. Built with React Flow, this example transforms traditional fishbone diagrams into flexible, editable, and dynamic visual workflows.
Also known as a Cause and Effect Diagram or Ishikawa Diagram, a fishbone diagram organizes potential causes into categories such as Management, Machine, Material, Methods, Environment, and Manpower. It helps teams identify contributing factors and understand the underlying reasons behind a problem.
Build Interactive Fishbone Diagrams with React Flow
The VisualFlow Fishbone Diagram Builder brings traditional root cause analysis into an interactive React Flow environment. Instead of working with static diagrams, users can create, customize, and manage diagram structures using an editable node-based interface.
Key capabilities include:
- Drag-and-Drop Editing: Easily arrange diagram nodes and branches.
- Editable Nodes: Customize root causes, sub-causes, and category labels.
- JSON to Flow: Convert structured JSON data into visual fishbone diagrams.
- Custom Labels: Organize causes under different categories.
- Live Updates: Reflect changes dynamically while editing.
- ELK Layout: Use automated graph layout to organize complex diagram structures.
How Does a Fishbone Diagram Work?
A fishbone diagram starts with a central problem statement, represented by the fish's head. Its main branches represent categories of potential causes, while smaller branches identify specific contributing factors.
For example, a manufacturing team investigating Poor Product Quality might organize its analysis into six categories:
- Management: Leadership, planning, training, and supervision.
- Machine: Maintenance, equipment capability, and calibration.
- Material: Material quality, inspection, and storage.
- Methods: Procedures, processes, and operational standards.
- Environment: Temperature, humidity, ventilation, and workplace conditions.
- Manpower: Skills, motivation, qualifications, and training.
With React Flow, each category and contributing factor can be represented as an editable node connected through visual edges.
Why Use React Flow for Fishbone Diagrams?
React Flow provides a flexible foundation for building interactive node-based applications. Its customizable nodes, edges, handles, and graph interactions make it suitable for developing advanced fishbone diagram editors.
Unlike static diagramming tools, a React Flow-based implementation can support dynamic data structures, interactive editing, custom layouts, and application-specific workflows.
Developers can also extend the builder with JSON-based data management, automated graph organization, and custom React components.
Frequently Asked Questions
1. What is a React Flow Fishbone Diagram Builder?
It is an interactive diagramming application built with React Flow that allows users to create, edit, and visualize Ishikawa diagrams for root cause analysis.
2. What is a Fishbone Diagram used for?
A fishbone diagram helps identify, categorize, and analyze potential causes of a specific problem. It is commonly used in quality management, manufacturing, business analysis, and process improvement.
3. Can you create an editable Fishbone Diagram with React Flow?
Yes. React Flow supports custom nodes, edges, drag-and-drop interactions, and dynamic graph updates, making it suitable for building editable fishbone diagram applications.
4. Can Fishbone Diagram data be generated from JSON?
Yes. A structured JSON representation can define the problem, cause categories, and contributing factors, which can then be converted into a React Flow graph.
Explore the React Flow Fishbone Diagram Example
Explore how React Flow can transform traditional cause-and-effect diagrams into interactive visual analysis tools.
VisualFlow provides practical React Flow examples and ready-to-explore implementations for developers building workflow editors, diagramming applications, and advanced node-based interfaces.
Discover more interactive examples at VisualFlow.
Key Features & Capabilities
Architecture & Technologies
Related Blueprints
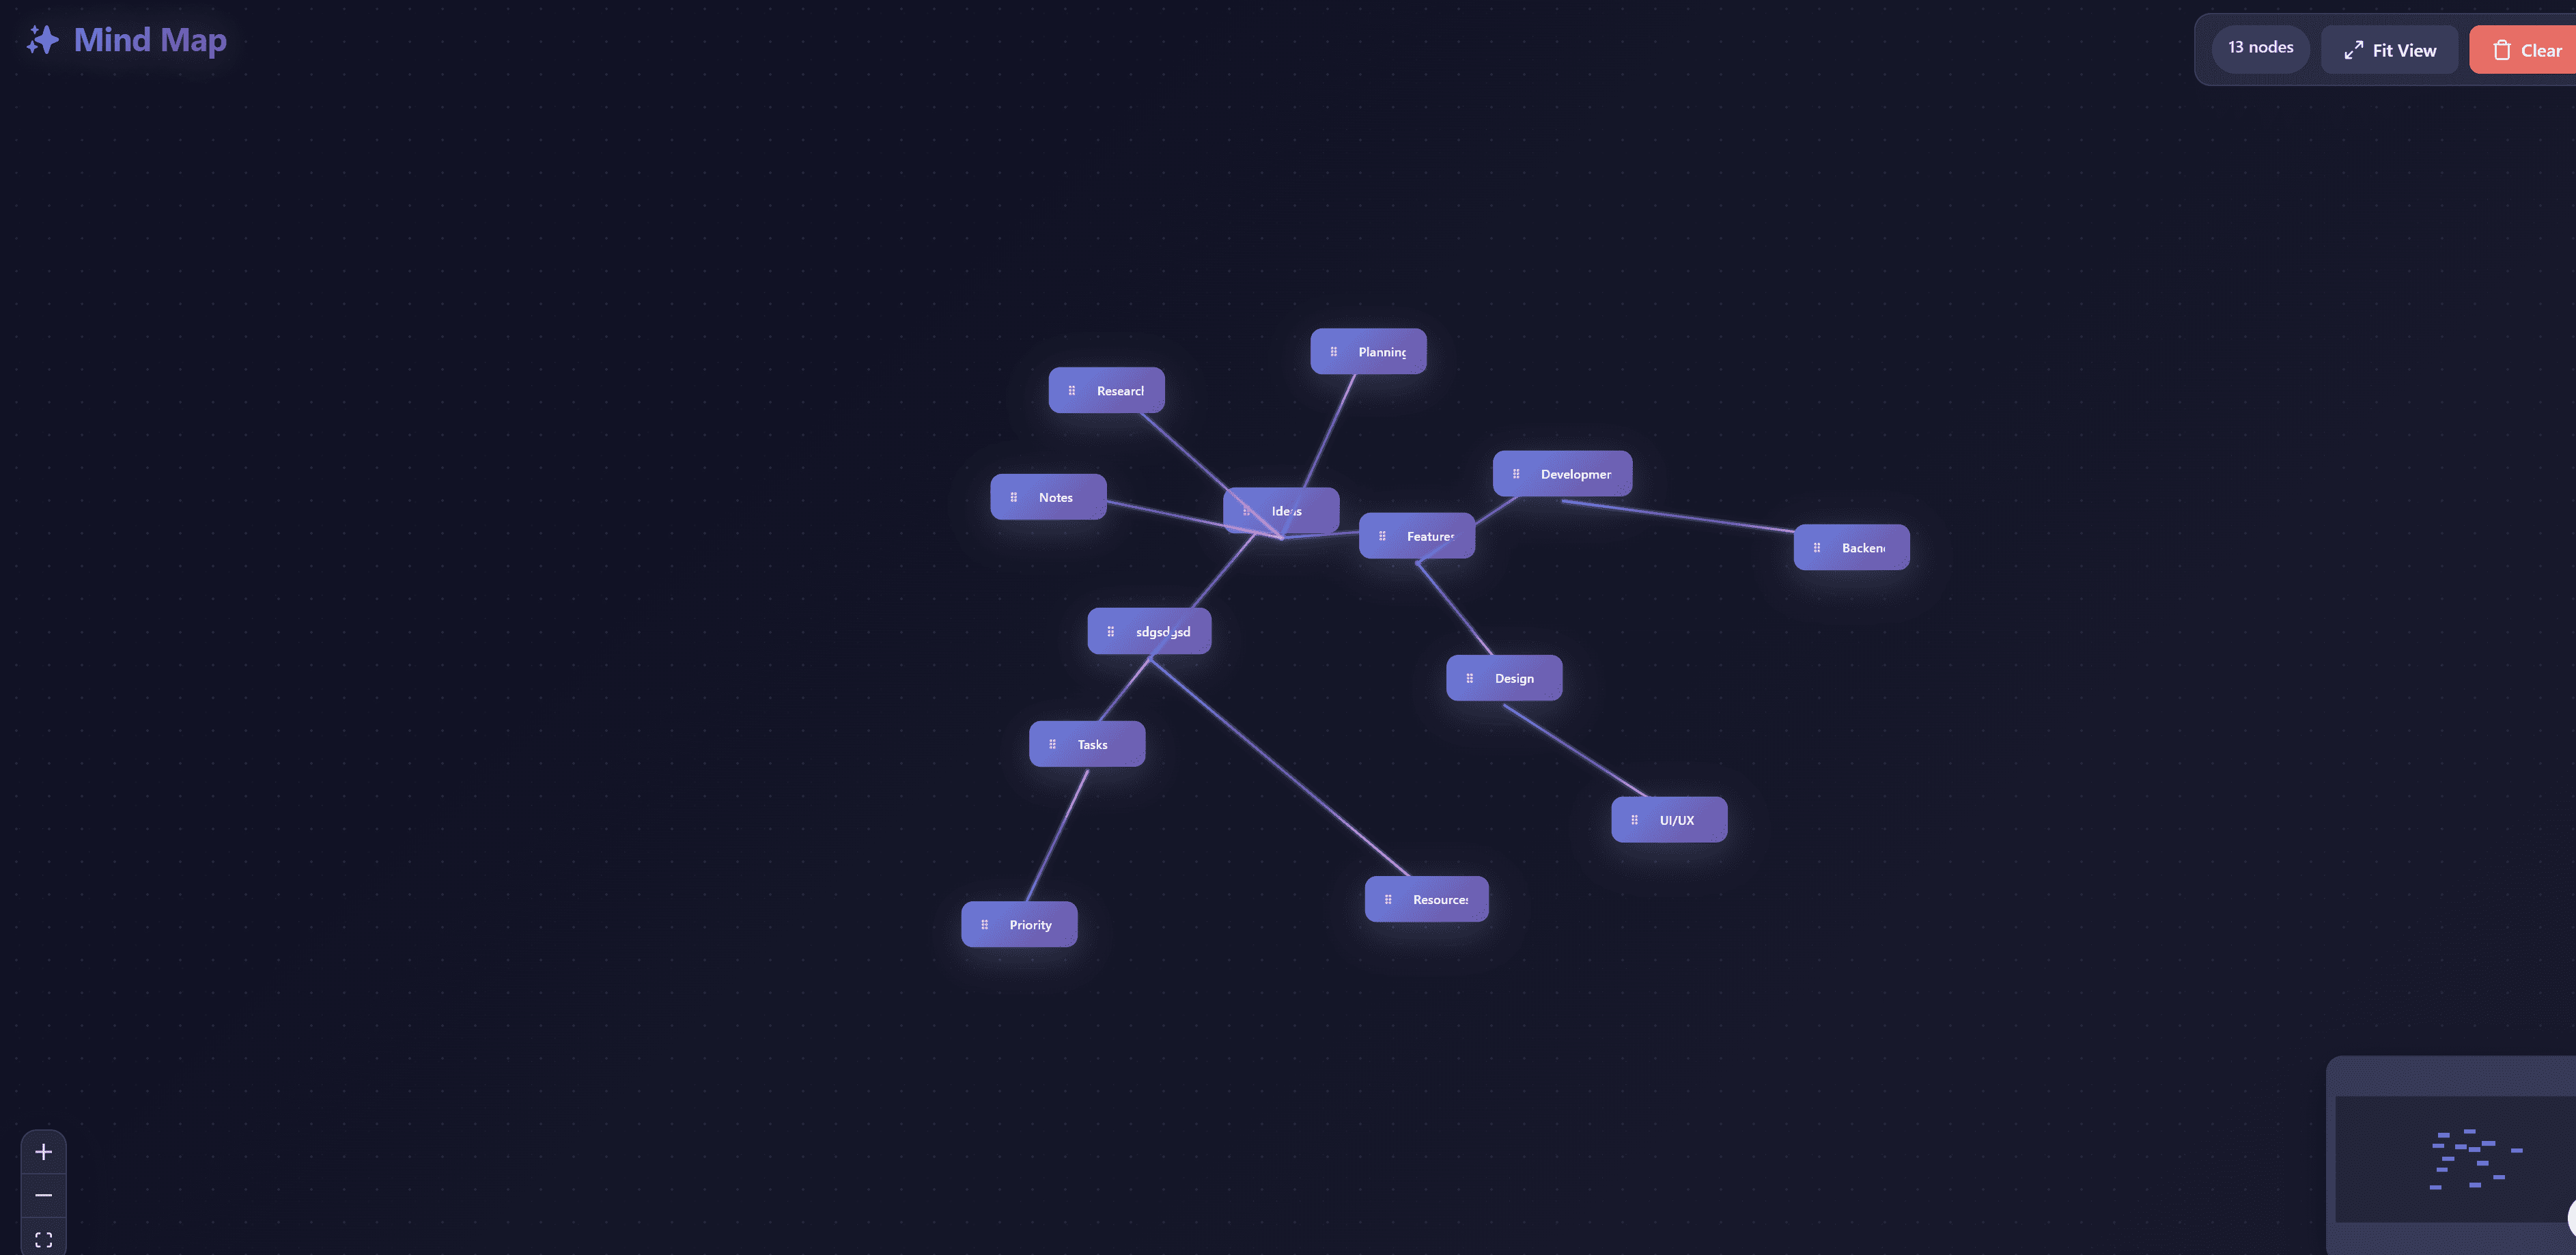
React flow concept map
Interactive concept mapping tool for organizing knowledge and visualizing relationships between ideas. Create hierarchical concept maps with drag-and-drop nodes, custom connections, and rich text editing. Perfect for education, research, brainstorming, and knowledge management with intuitive interface for building complex conceptual relationships.

React flow Kanban Pattern
A free example demonstrating how to build a Kanban board interface using React Flow. Easily visualize and manage tasks across different stages.

React flow State Machine
A free example demonstrating how to visualize state machines and state transitions using React Flow.