Fish bone diagram with React flow
$39
About Fish bone diagram with React flow
A powerful interactive data analysis and visualization flow builder using React Flow. Connect data sources, apply transformations, and visualize results seamlessly.
Analyze Fish provides a comprehensive canvas for building data processing pipelines and visual analytics. With customizable nodes for data ingestion, transformation, and visualization, you can quickly build advanced analytical dashboards tailored to your specific needs.
Key Features & Capabilities
Architecture & Technologies
Related Blueprints
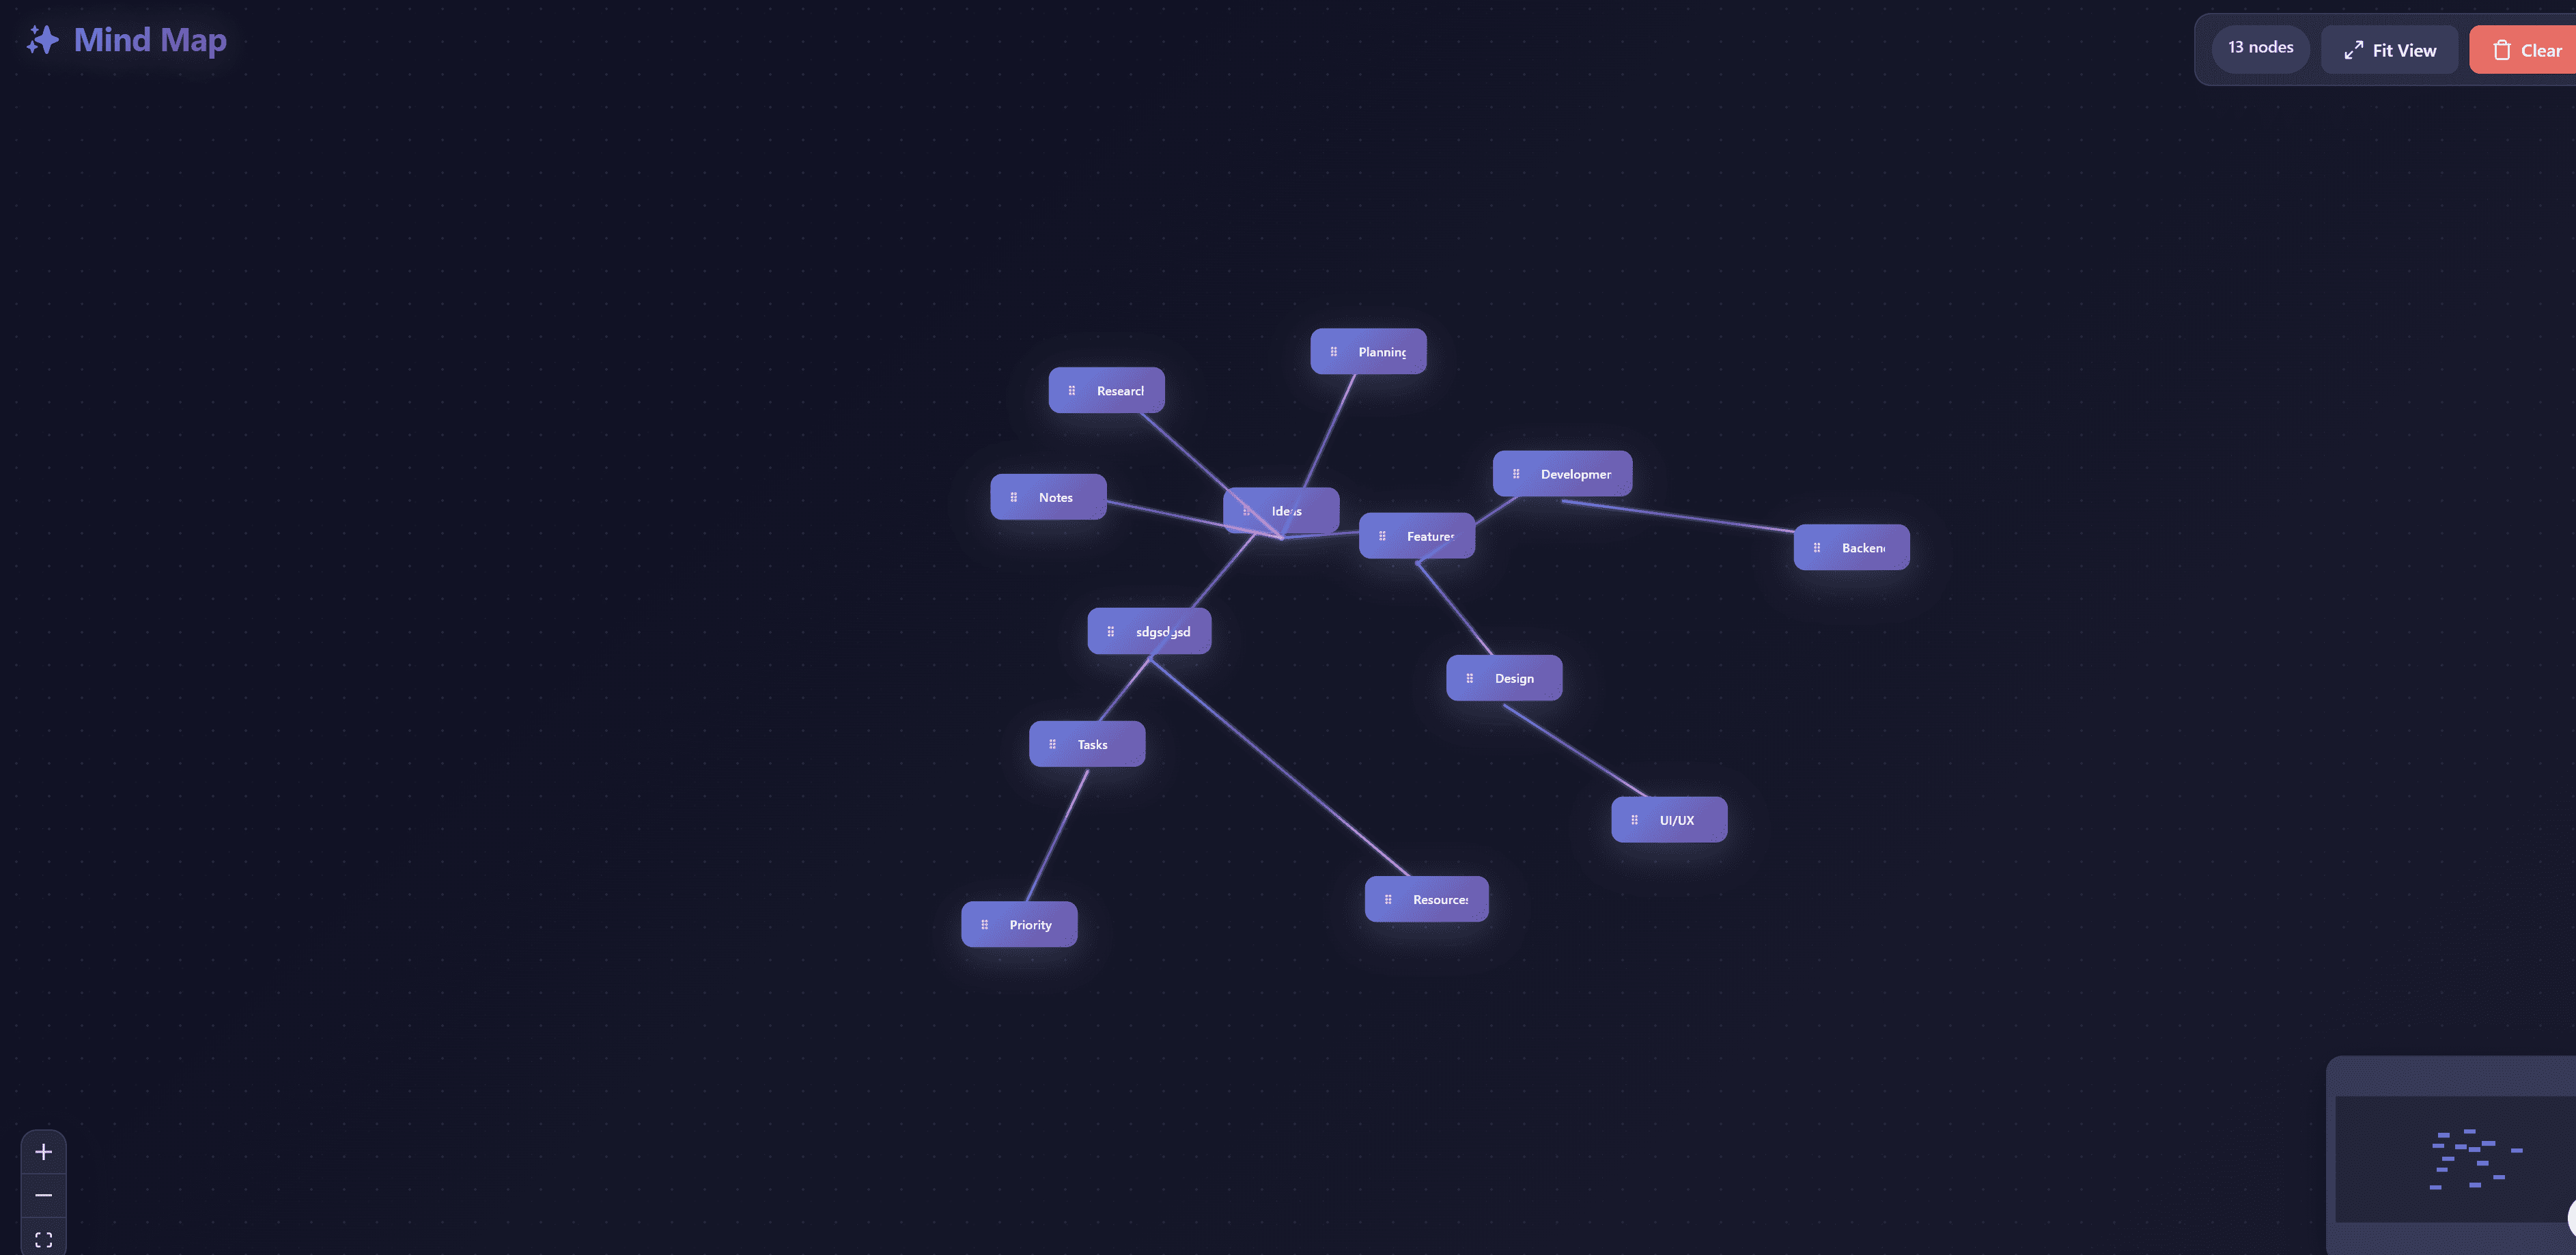
React flow concept map
Interactive concept mapping tool for organizing knowledge and visualizing relationships between ideas. Create hierarchical concept maps with drag-and-drop nodes, custom connections, and rich text editing. Perfect for education, research, brainstorming, and knowledge management with intuitive interface for building complex conceptual relationships.

React flow Kanban Pattern
A free example demonstrating how to build a Kanban board interface using React Flow. Easily visualize and manage tasks across different stages.

React flow State Machine
A free example demonstrating how to visualize state machines and state transitions using React Flow.