React Flow Neural Network Visualization: Interactive Deep Learning Architecture Diagrams
Neural Network Visualization demonstrates how ReactFlow can be used to create stunning, interactive visualizations of deep learning architectures. This powerful tool provides educators, researchers, and developers with an intuitive way to visualize and explain complex neural network structures, making AI more accessible and understandable.
Why Visualize Neural Networks?
Understanding neural networks can be challenging, especially when dealing with multi-layer architectures, various activation functions, and complex data flows. Traditional documentation and static diagrams often fail to capture the dynamic nature of neural networks and how data moves through different layers.
Interactive visualizations solve this problem by:
- Making complex architectures understandable: Visual representations help both technical and non-technical audiences grasp how neural networks work
- Enhancing educational content: Students and learners can interact with models to see how data flows through layers
- Improving documentation: Technical documentation becomes more engaging and easier to follow
- Facilitating research: Researchers can visualize and compare different architectures side-by-side
Key Features
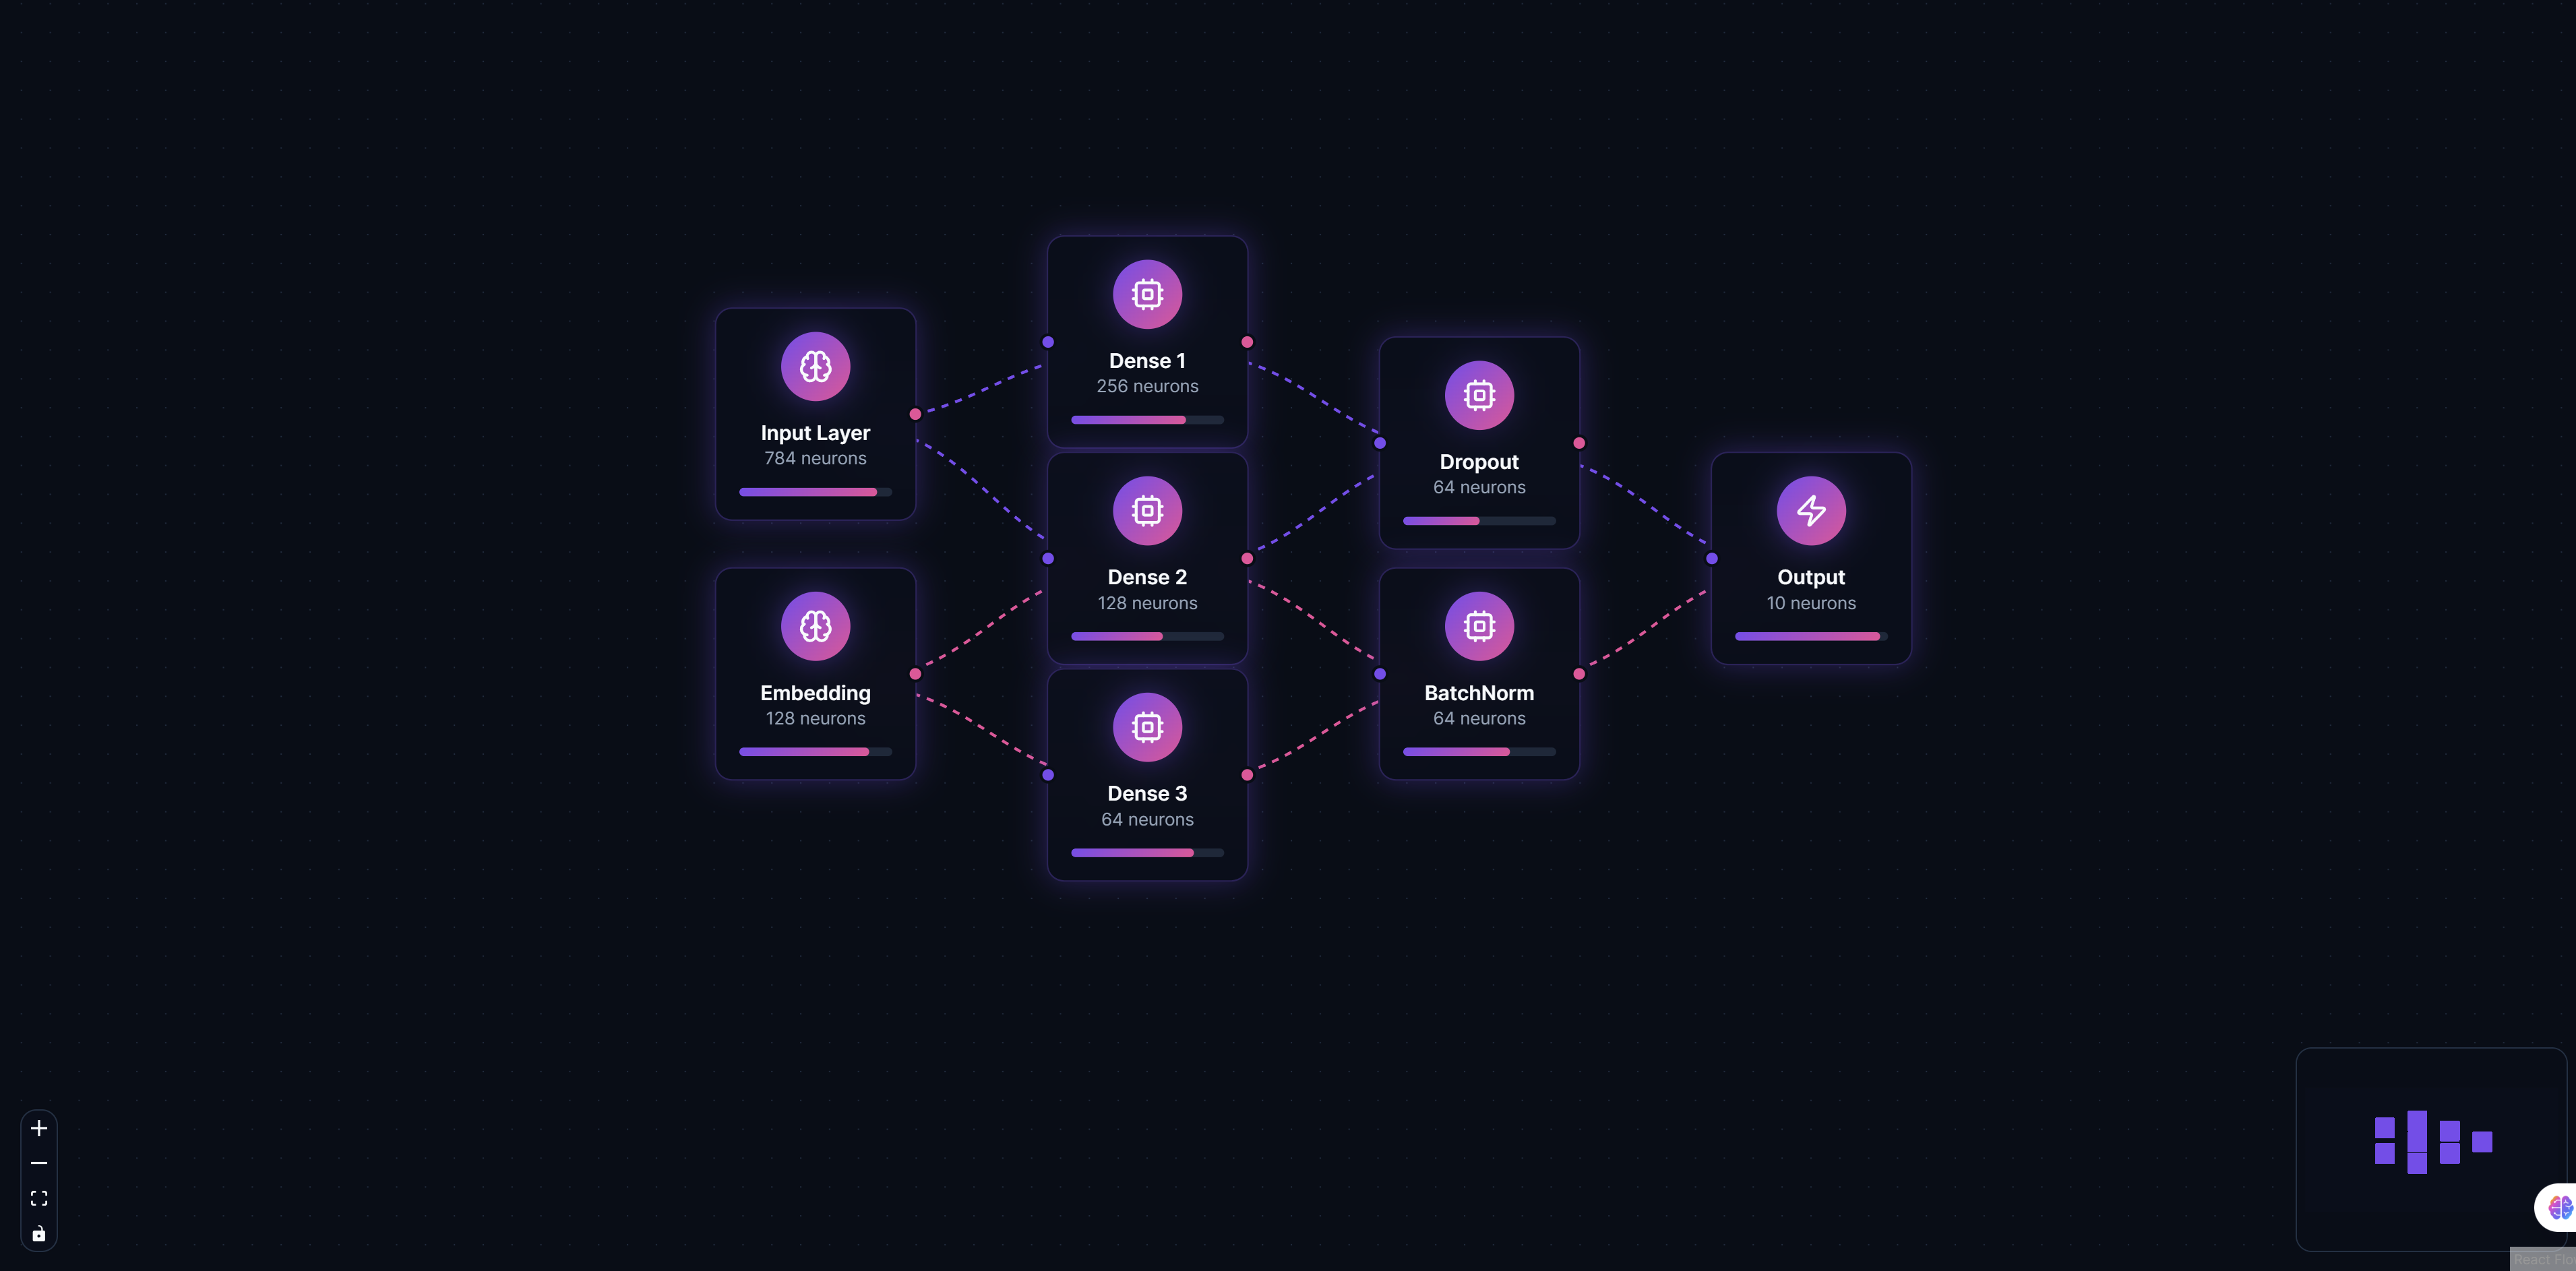
Layer Visualization
Create distinct visual representations for different neural network layers:
- Input Layers: Represent data entry points with customizable styling
- Hidden Layers: Visualize intermediate processing layers with configurable depth
- Output Layers: Show final prediction or classification layers
Each layer type can be styled differently to make the architecture immediately recognizable and easy to understand.
Connection Mapping
Visualize weighted connections between neurons with:
- Customizable edge thickness: Thicker edges represent stronger connections or higher weights
- Color coding: Use colors to represent different weight ranges or connection types
- Interactive tooltips: Hover over connections to see detailed weight values and statistics
- Connection filtering: Show or hide connections based on weight thresholds
Interactive Nodes
Click on any node to view detailed information including:
- Layer properties and configuration
- Activation functions used
- Number of neurons or units
- Parameter counts
- Training statistics (if available)
This interactivity transforms static diagrams into dynamic learning tools.
Custom Styling
Fully customizable node and edge styles allow you to:
- Match your brand colors and design system
- Create theme variations for different use cases
- Highlight specific layers or connections
- Add custom icons and labels
Export Capabilities
Export neural network diagrams to multiple formats:
- PNG: High-resolution images for presentations and documentation
- SVG: Scalable vector graphics for web and print
- PDF: Professional documentation format
- JSON: Machine-readable format for programmatic use
Implementation Details
Custom Node Types
ReactFlow allows you to create custom node types for different layer types:
// Example: Custom node type for neural network layers
const LayerNode = ({ data }) => {
  return (
    <div className={`layer-node layer-${data.type}`}>
      <div className="layer-header">{data.name}</div>
      <div className="layer-info">
        <div>Units: {data.units}</div>
        <div>Activation: {data.activation}</div>
        <div>Parameters: {data.parameters}</div>
      </div>
    </div>
  );
};
Weight Visualization
Connections between layers can be styled based on weight values:
// Example: Edge styling based on weights
const getEdgeStyle = (weight) => {
  const normalizedWeight = Math.abs(weight);
  const thickness = Math.max(1, normalizedWeight * 10);
  const opacity = Math.min(1, normalizedWeight * 2);

  return {
    strokeWidth: thickness,
    strokeOpacity: opacity,
    stroke: weight > 0 ? '#4CAF50' : '#F44336', // Green for positive, red for negative
  };
};
Data Flow Animation
Animate data flow through the network to show how information propagates:
// Example: Animated data flow
const animateDataFlow = (inputData) => {
  // Propagate data through layers
  layers.forEach((layer, index) => {
    setTimeout(() => {
      highlightLayer(layer.id);
      const output = processLayer(layer, inputData);
      inputData = output;
    }, index * 500);
  });
};
Use Cases
Machine Learning Education
Educational platforms can use neural network visualizations to:
- Teach students about different architectures (CNNs, RNNs, Transformers)
- Demonstrate how data flows through networks
- Compare different model architectures
- Show the impact of different activation functions
Model Documentation
Document your AI models with interactive visualizations that:
- Show architecture at a glance
- Explain layer purposes and configurations
- Document hyperparameters and training details
- Provide visual references for stakeholders
Research Presentations
Enhance research presentations with:
- Clear visual representations of proposed architectures
- Comparisons between different model designs
- Interactive demos during presentations
- Publication-quality diagrams
Technical Documentation
Create comprehensive technical documentation that:
- Makes complex models accessible to non-experts
- Provides visual context for code documentation
- Helps onboard new team members
- Serves as reference material
Integration with ML Frameworks
The visualization tool can integrate with popular ML frameworks:
TensorFlow/Keras
Import model architectures directly from TensorFlow/Keras:
# Export model architecture
model_json = model.to_json()
# Convert to visualization format
visualization_data = convert_tensorflow_to_reactflow(model_json)
PyTorch
Extract architecture information from PyTorch models:
# Extract layer information
layers = extract_pytorch_layers(model)
# Generate visualization data
visualization_data = create_reactflow_data(layers)
Custom Models
Support for custom model formats through JSON schemas:
{
  "layers": [
    {
      "id": "input",
      "type": "input",
      "units": 784,
      "activation": "linear"
    },
    {
      "id": "hidden1",
      "type": "dense",
      "units": 128,
      "activation": "relu"
    }
  ],
  "connections": [
    {
      "source": "input",
      "target": "hidden1",
      "weights": "matrix"
    }
  ]
}
Best Practices
Layer Organization
- Group related layers: Use visual grouping to show layer relationships
- Maintain consistent spacing: Keep similar layer types at consistent distances
- Use color coding: Different colors for different layer types improve readability
Connection Visualization
- Filter by weight: Show only significant connections to reduce clutter
- Use gradients: Gradient colors can represent weight ranges effectively
- Limit visible connections: For dense networks, show connections selectively
Performance Optimization
- Virtualize large networks: Use viewport virtualization for networks with thousands of nodes
- Lazy load details: Load detailed information only when nodes are clicked
- Optimize rendering: Use React.memo and useMemo for expensive calculations
Benefits
For Educators
- Enhanced learning: Students understand concepts faster with visual aids
- Interactive teaching: Create engaging lessons with interactive diagrams
- Assessment tools: Use visualizations to test student understanding
For Researchers
- Clear communication: Explain complex architectures to peers and stakeholders
- Architecture comparison: Compare different model designs visually
- Publication quality: Generate publication-ready diagrams
For Developers
- Better documentation: Create comprehensive, visual documentation
- Team onboarding: Help new team members understand models quickly
- Stakeholder communication: Explain technical concepts to non-technical audiences
Conclusion
Neural Network Visualization with ReactFlow transforms how we understand and communicate about deep learning architectures. By making complex models visual and interactive, we make AI more accessible, understandable, and engaging.
Whether you're teaching machine learning, documenting models, or presenting research, interactive neural network visualizations provide a powerful tool for communication and understanding. The combination of ReactFlow's flexibility and neural network visualization creates an invaluable resource for the AI community.
Start visualizing your neural networks today and discover how interactive diagrams can enhance your work with deep learning models.